


Data collected at The University of Texas Marine Science Institute Pier Laboratory on the Aransas Pass Ship Channel linking Corpus Christi Bay to the Gulf of Mexico (27 50.3N; 97 03.1W).
These data are uncorrected and are provided for information purposes only. Time is reported as Central Standard Time (CST). Add one hour during Daylight Savings Time. We will eventually display time as Local Time (CST or CDT, whichever is in force).
As is typical with continuously recording instruments, there are occasional spikes in the data. These are usually obvious and should be ignored.
2024 Tide Charts - Texas Tides: Port Aransas Jetties
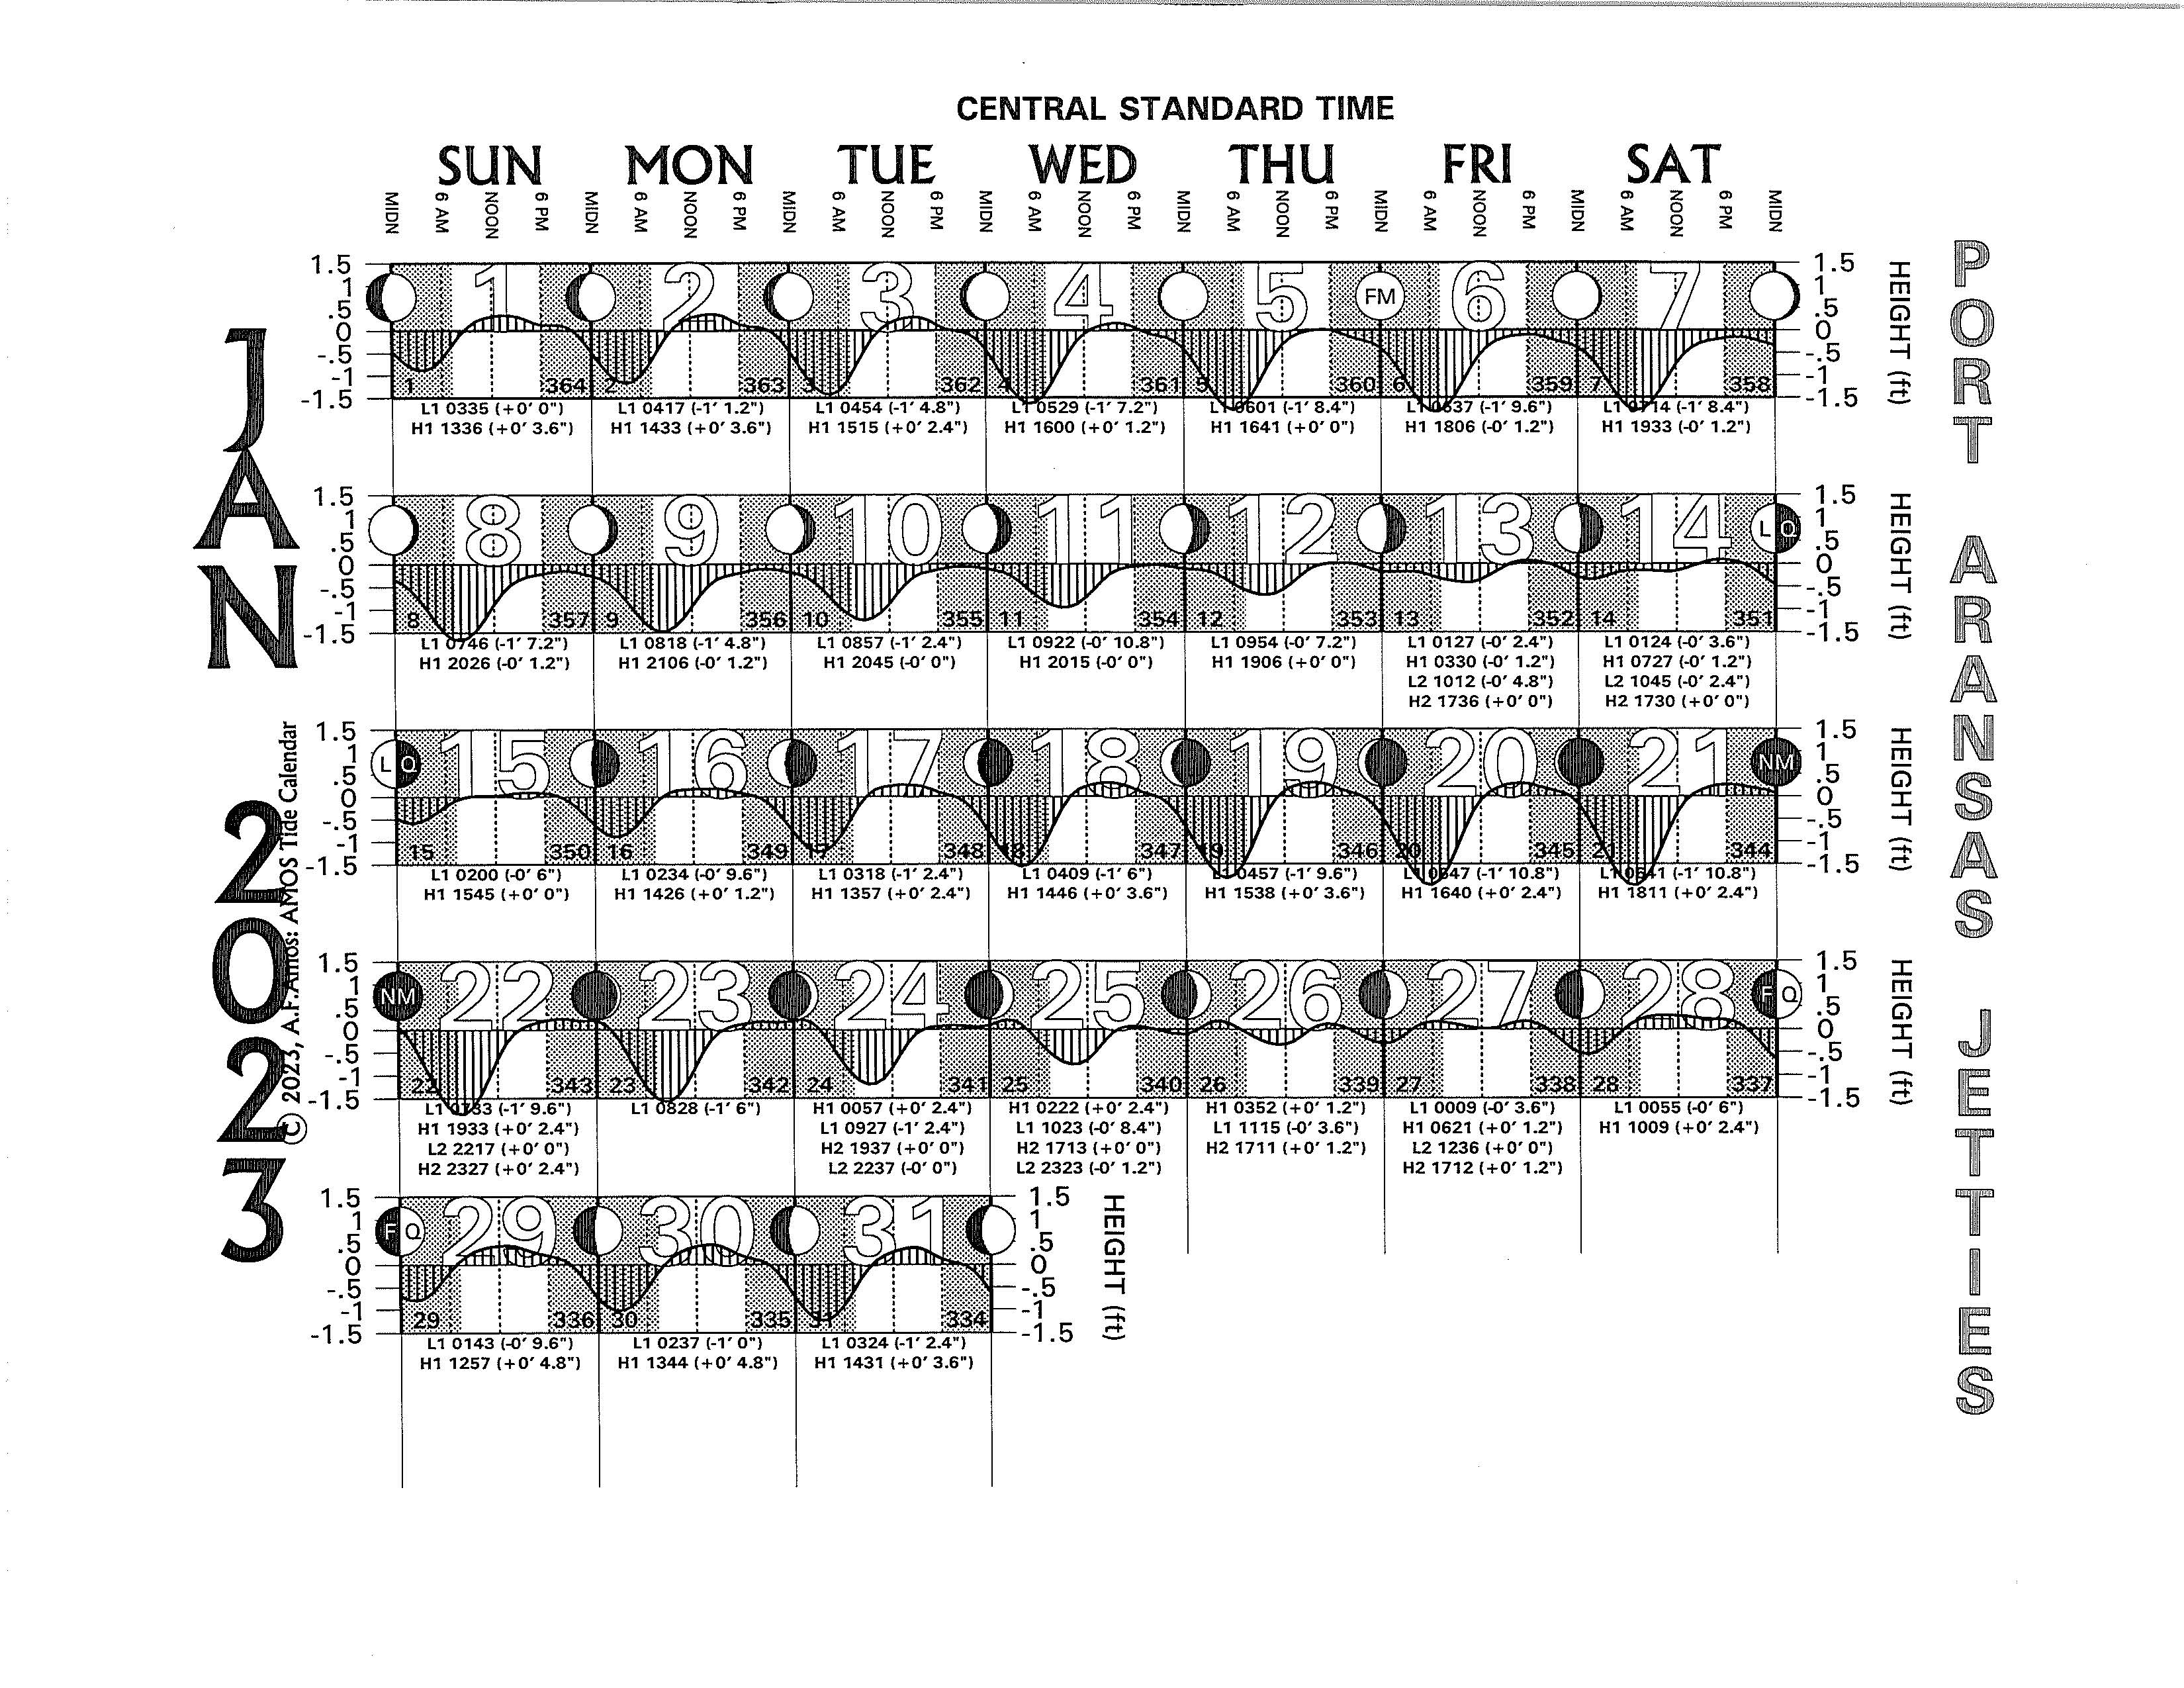
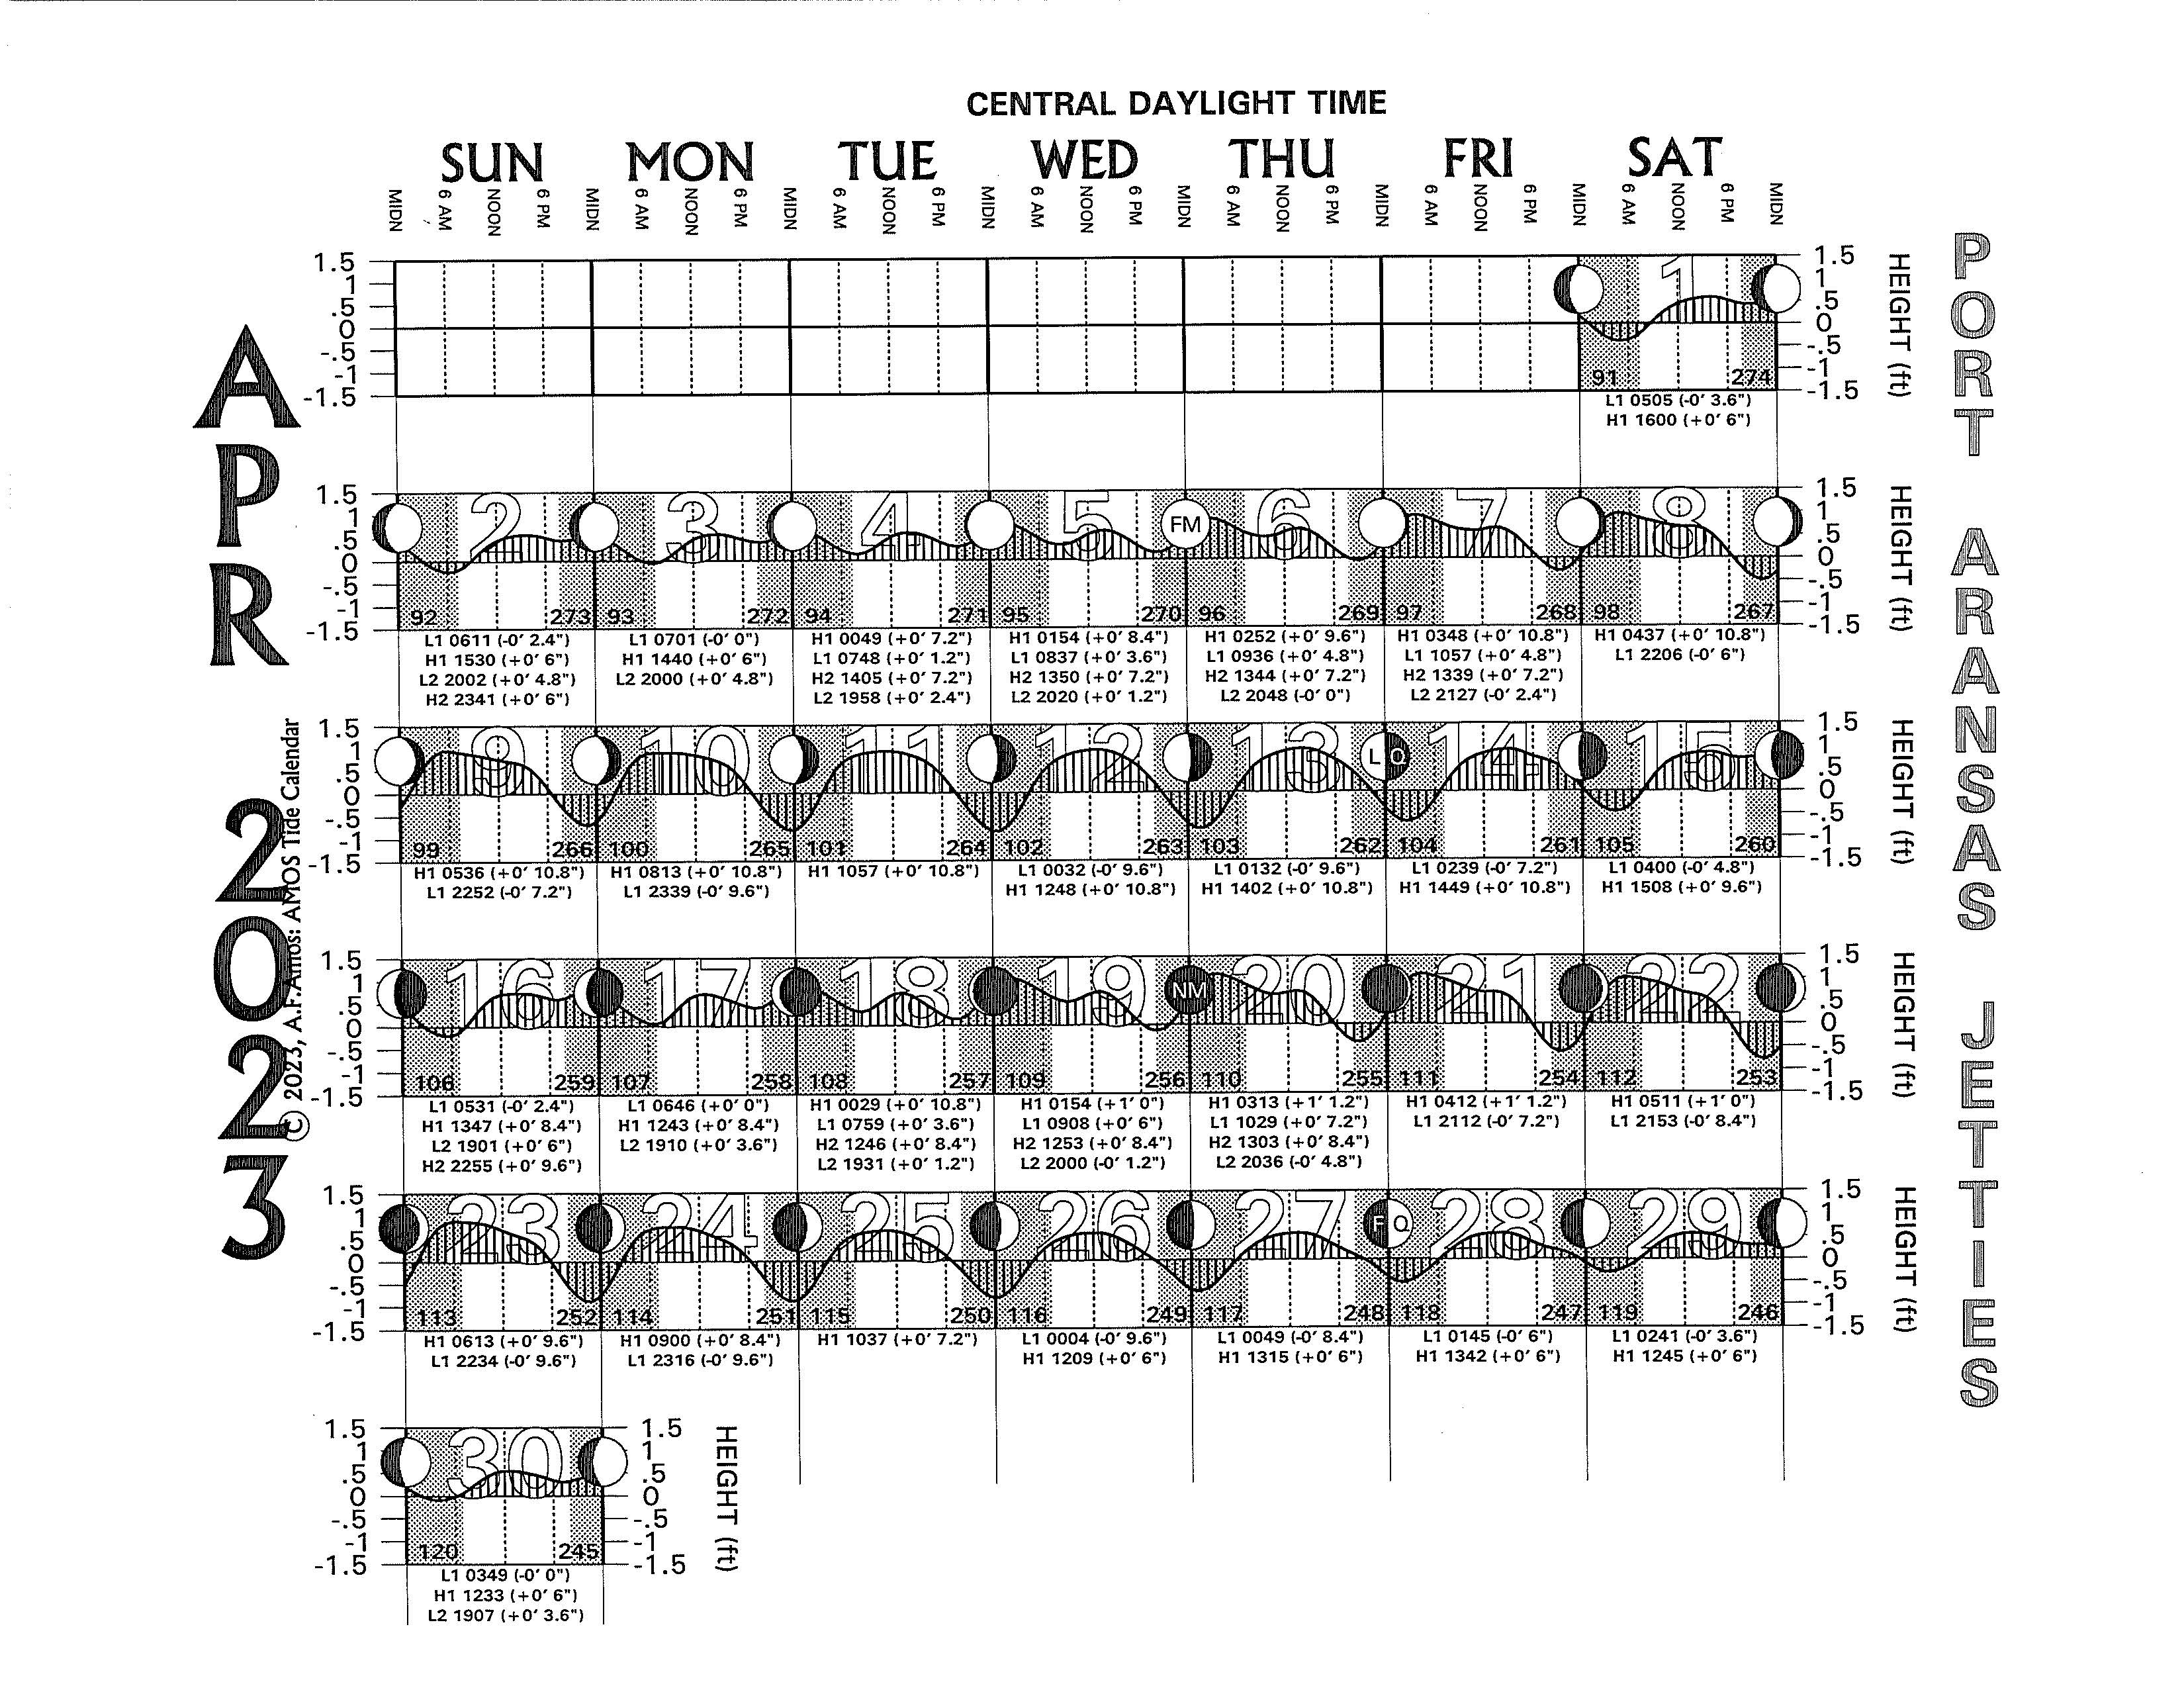
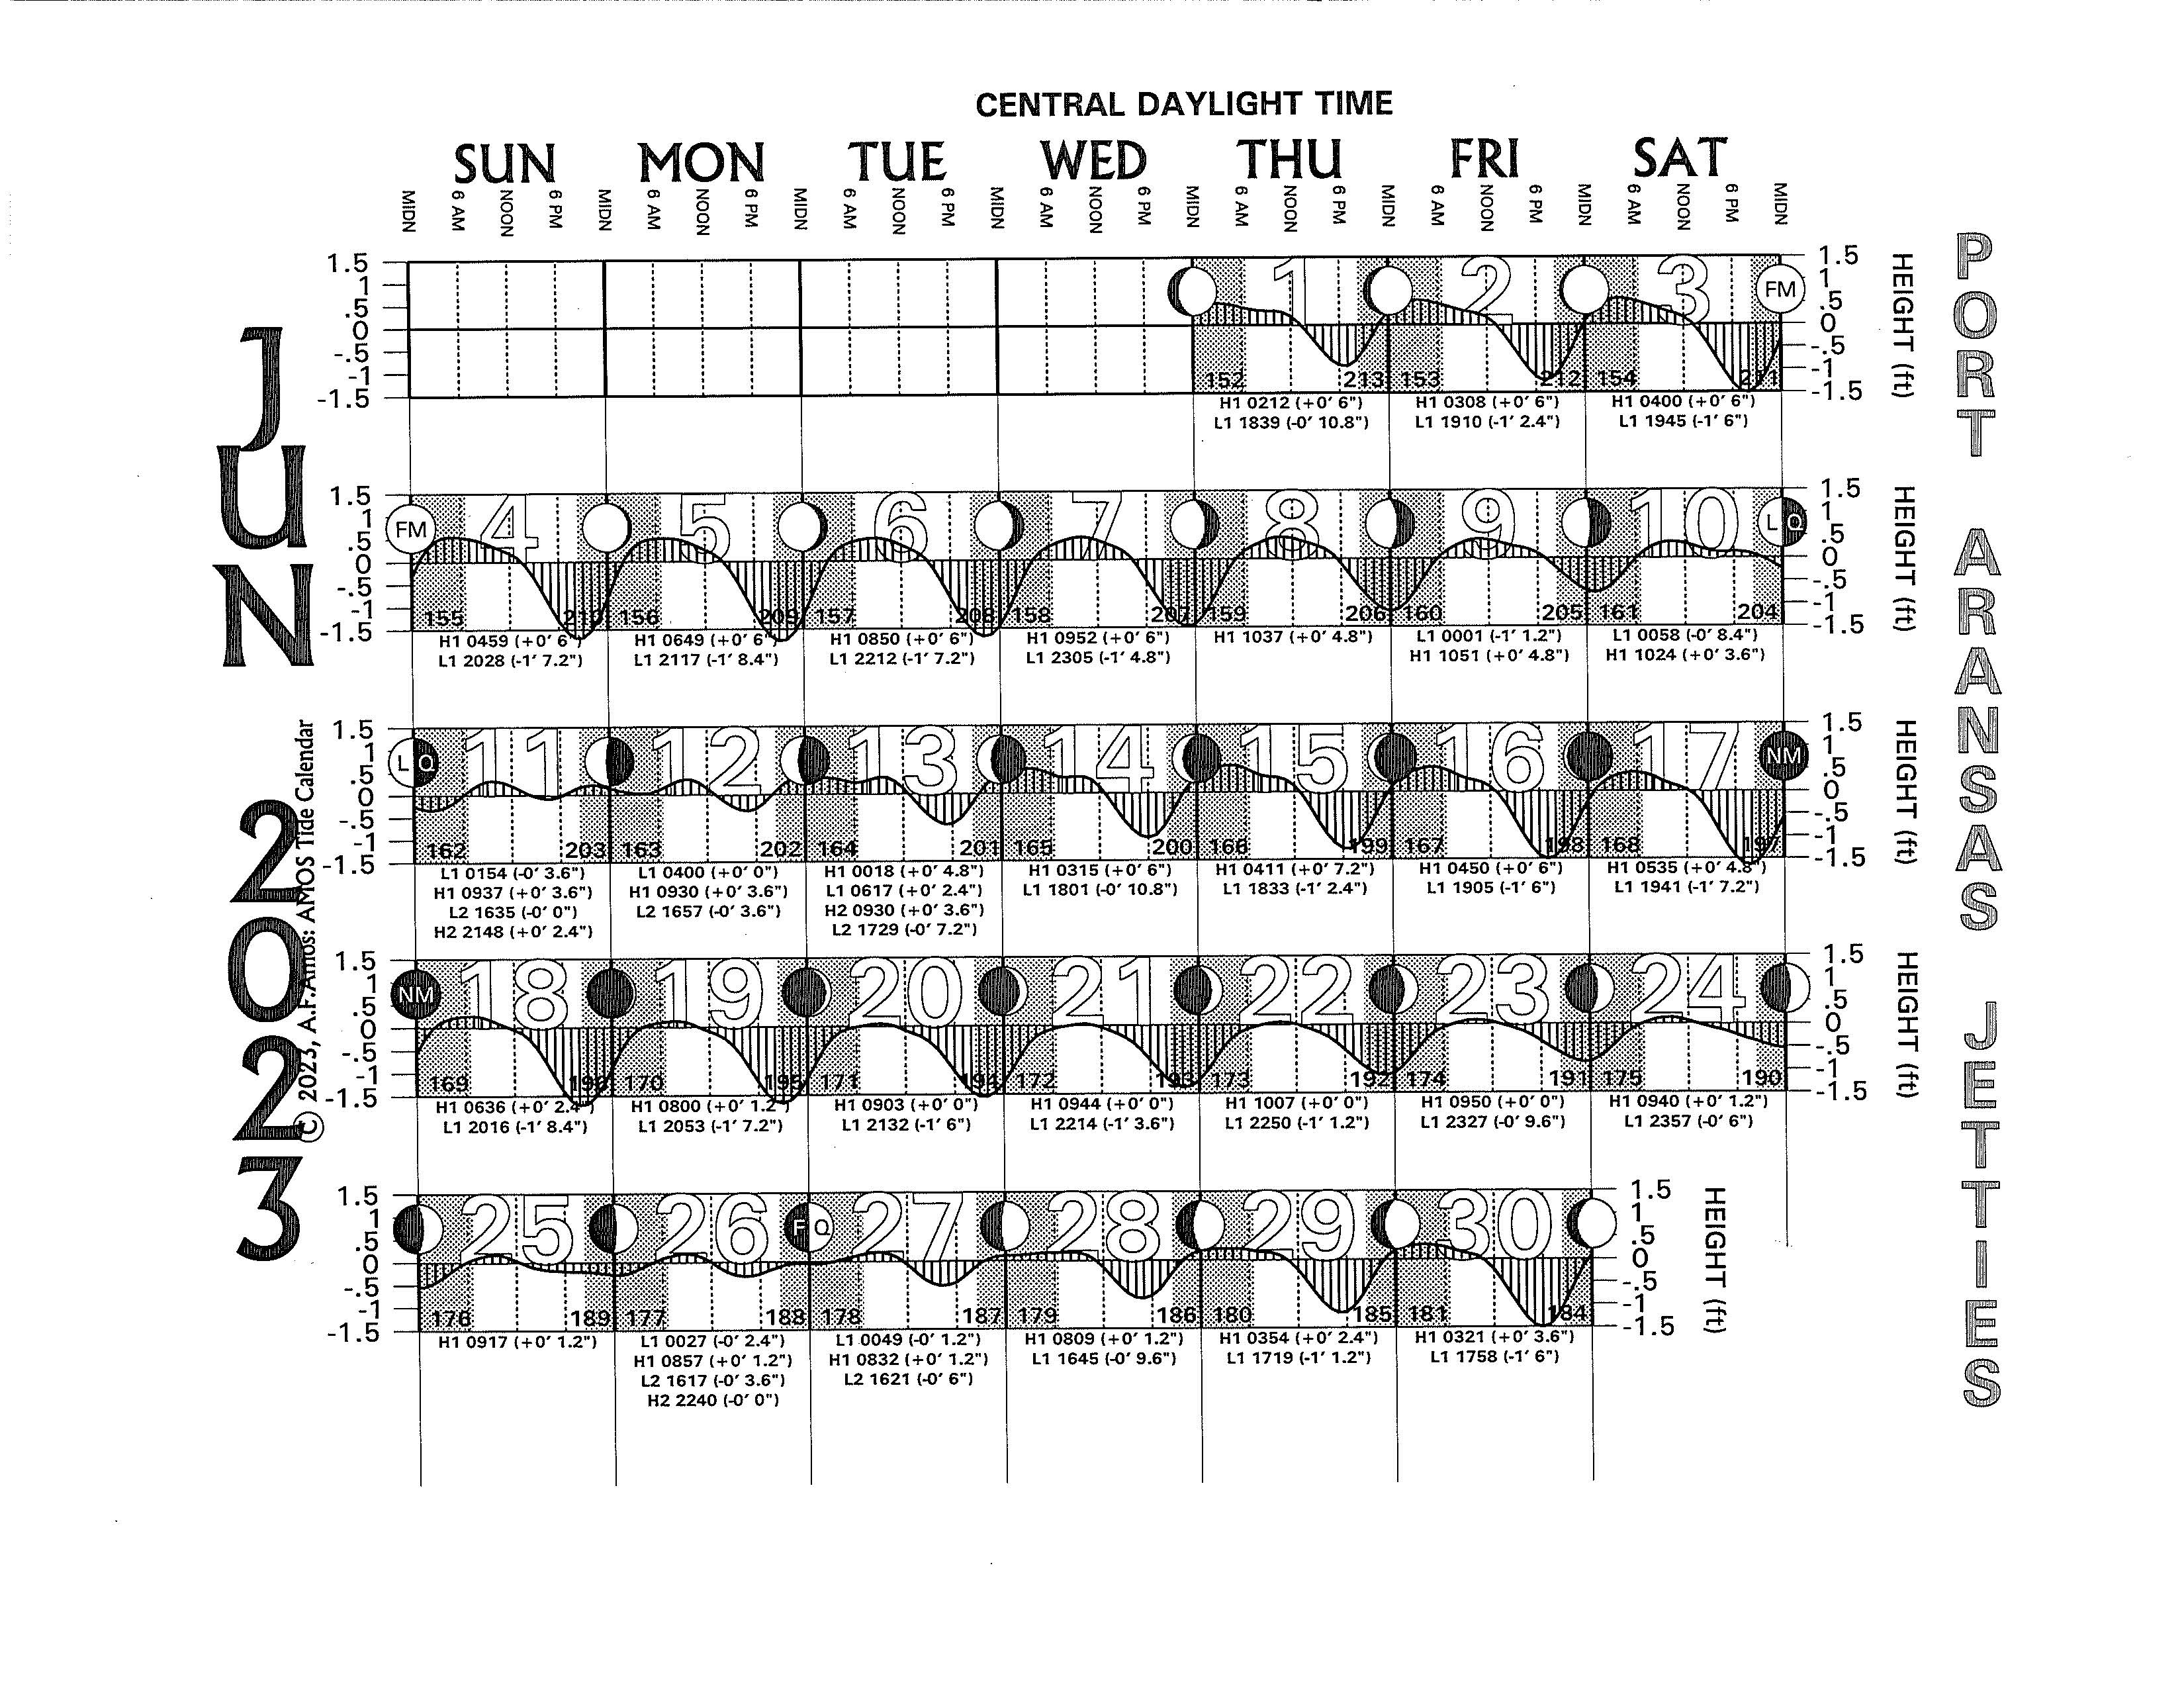
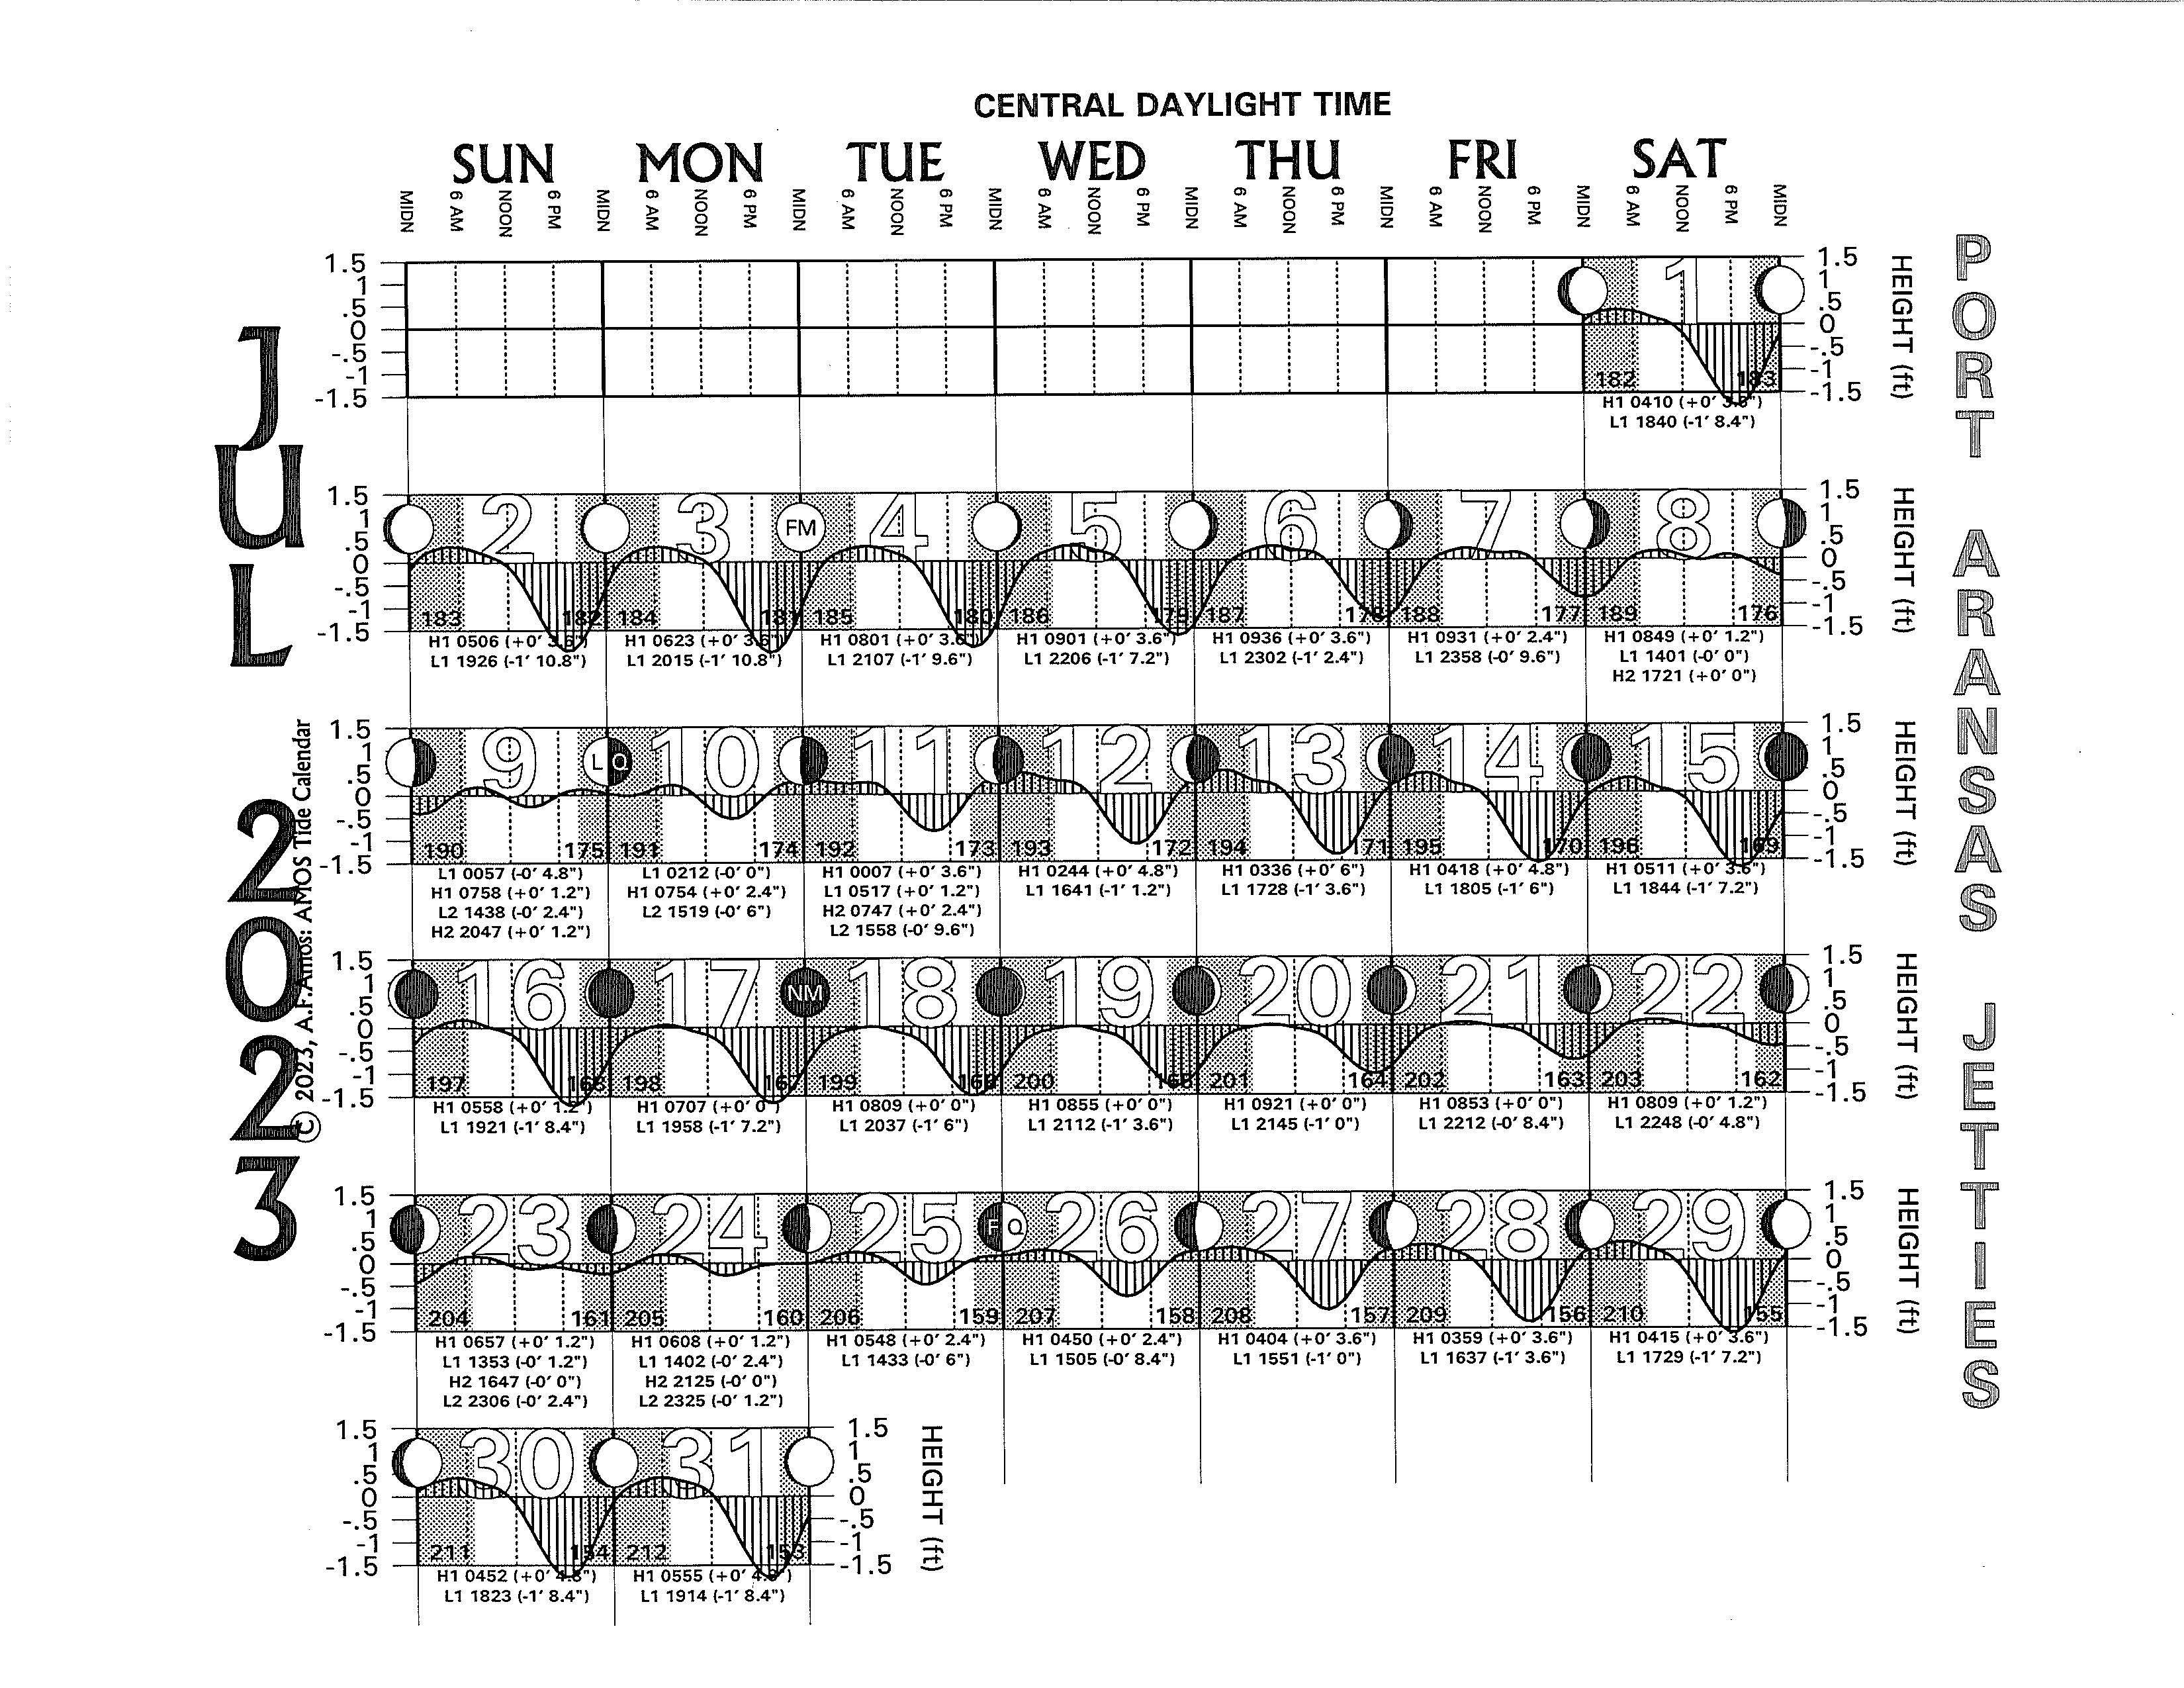
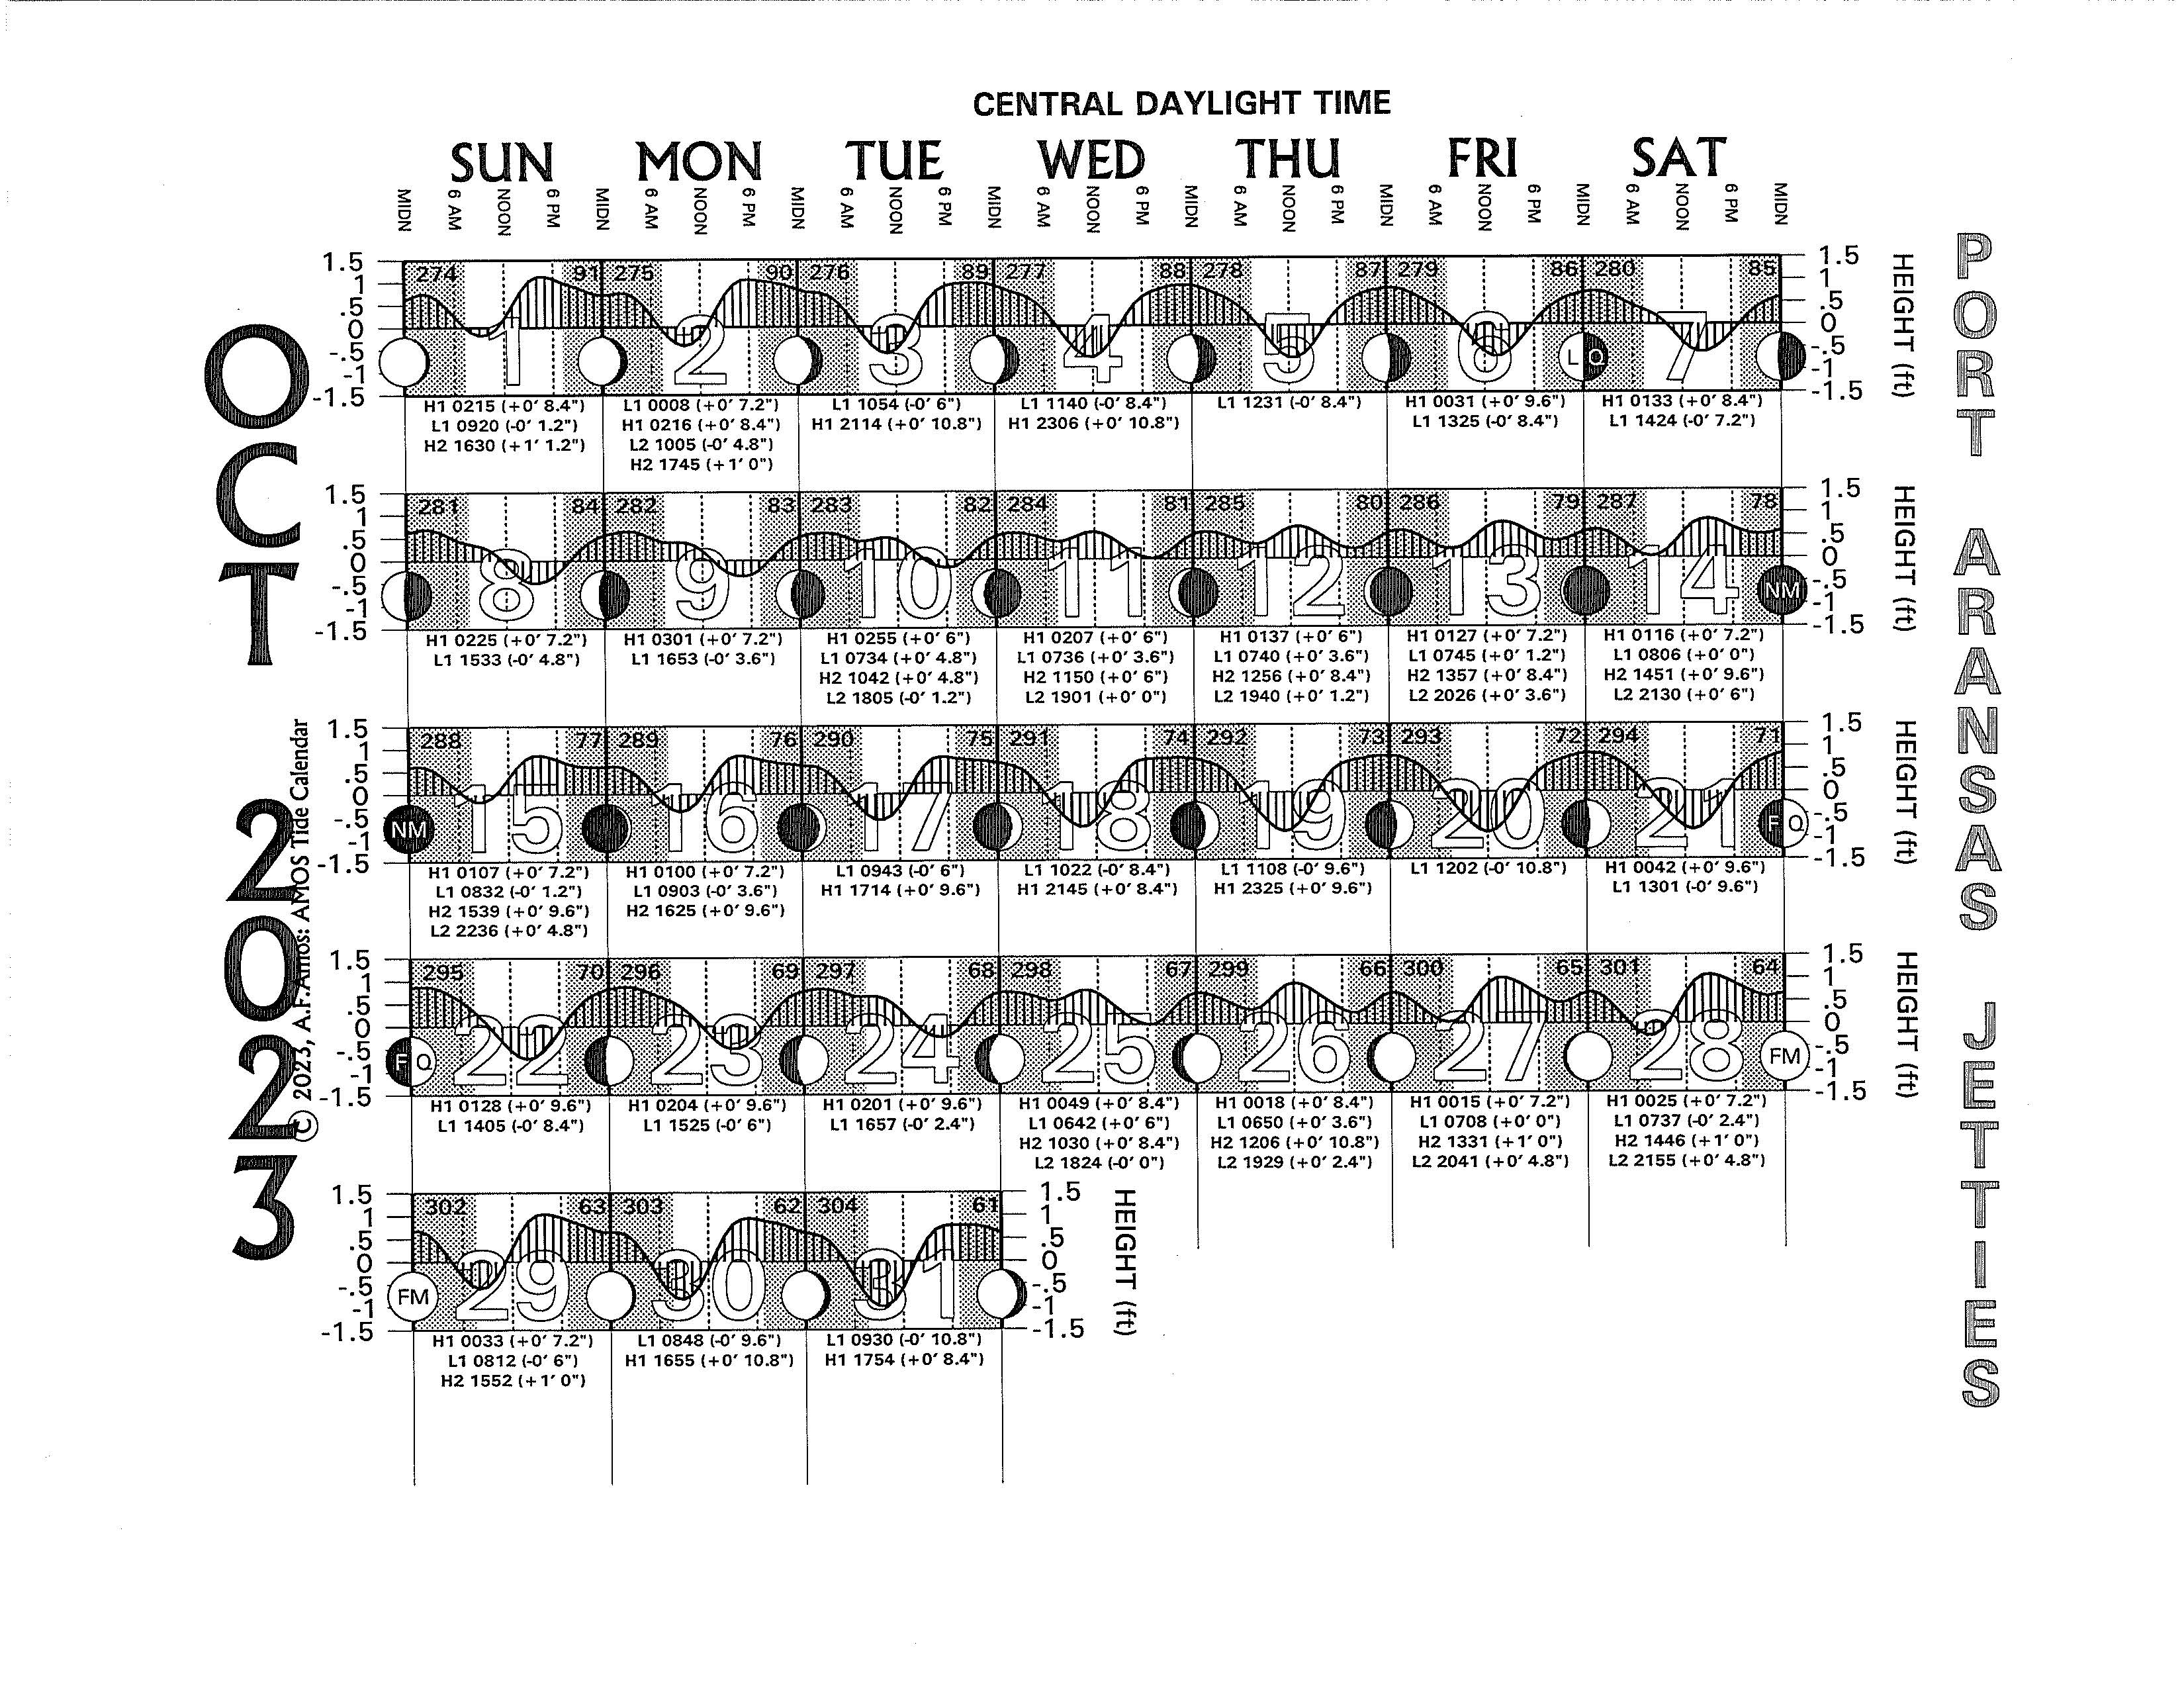
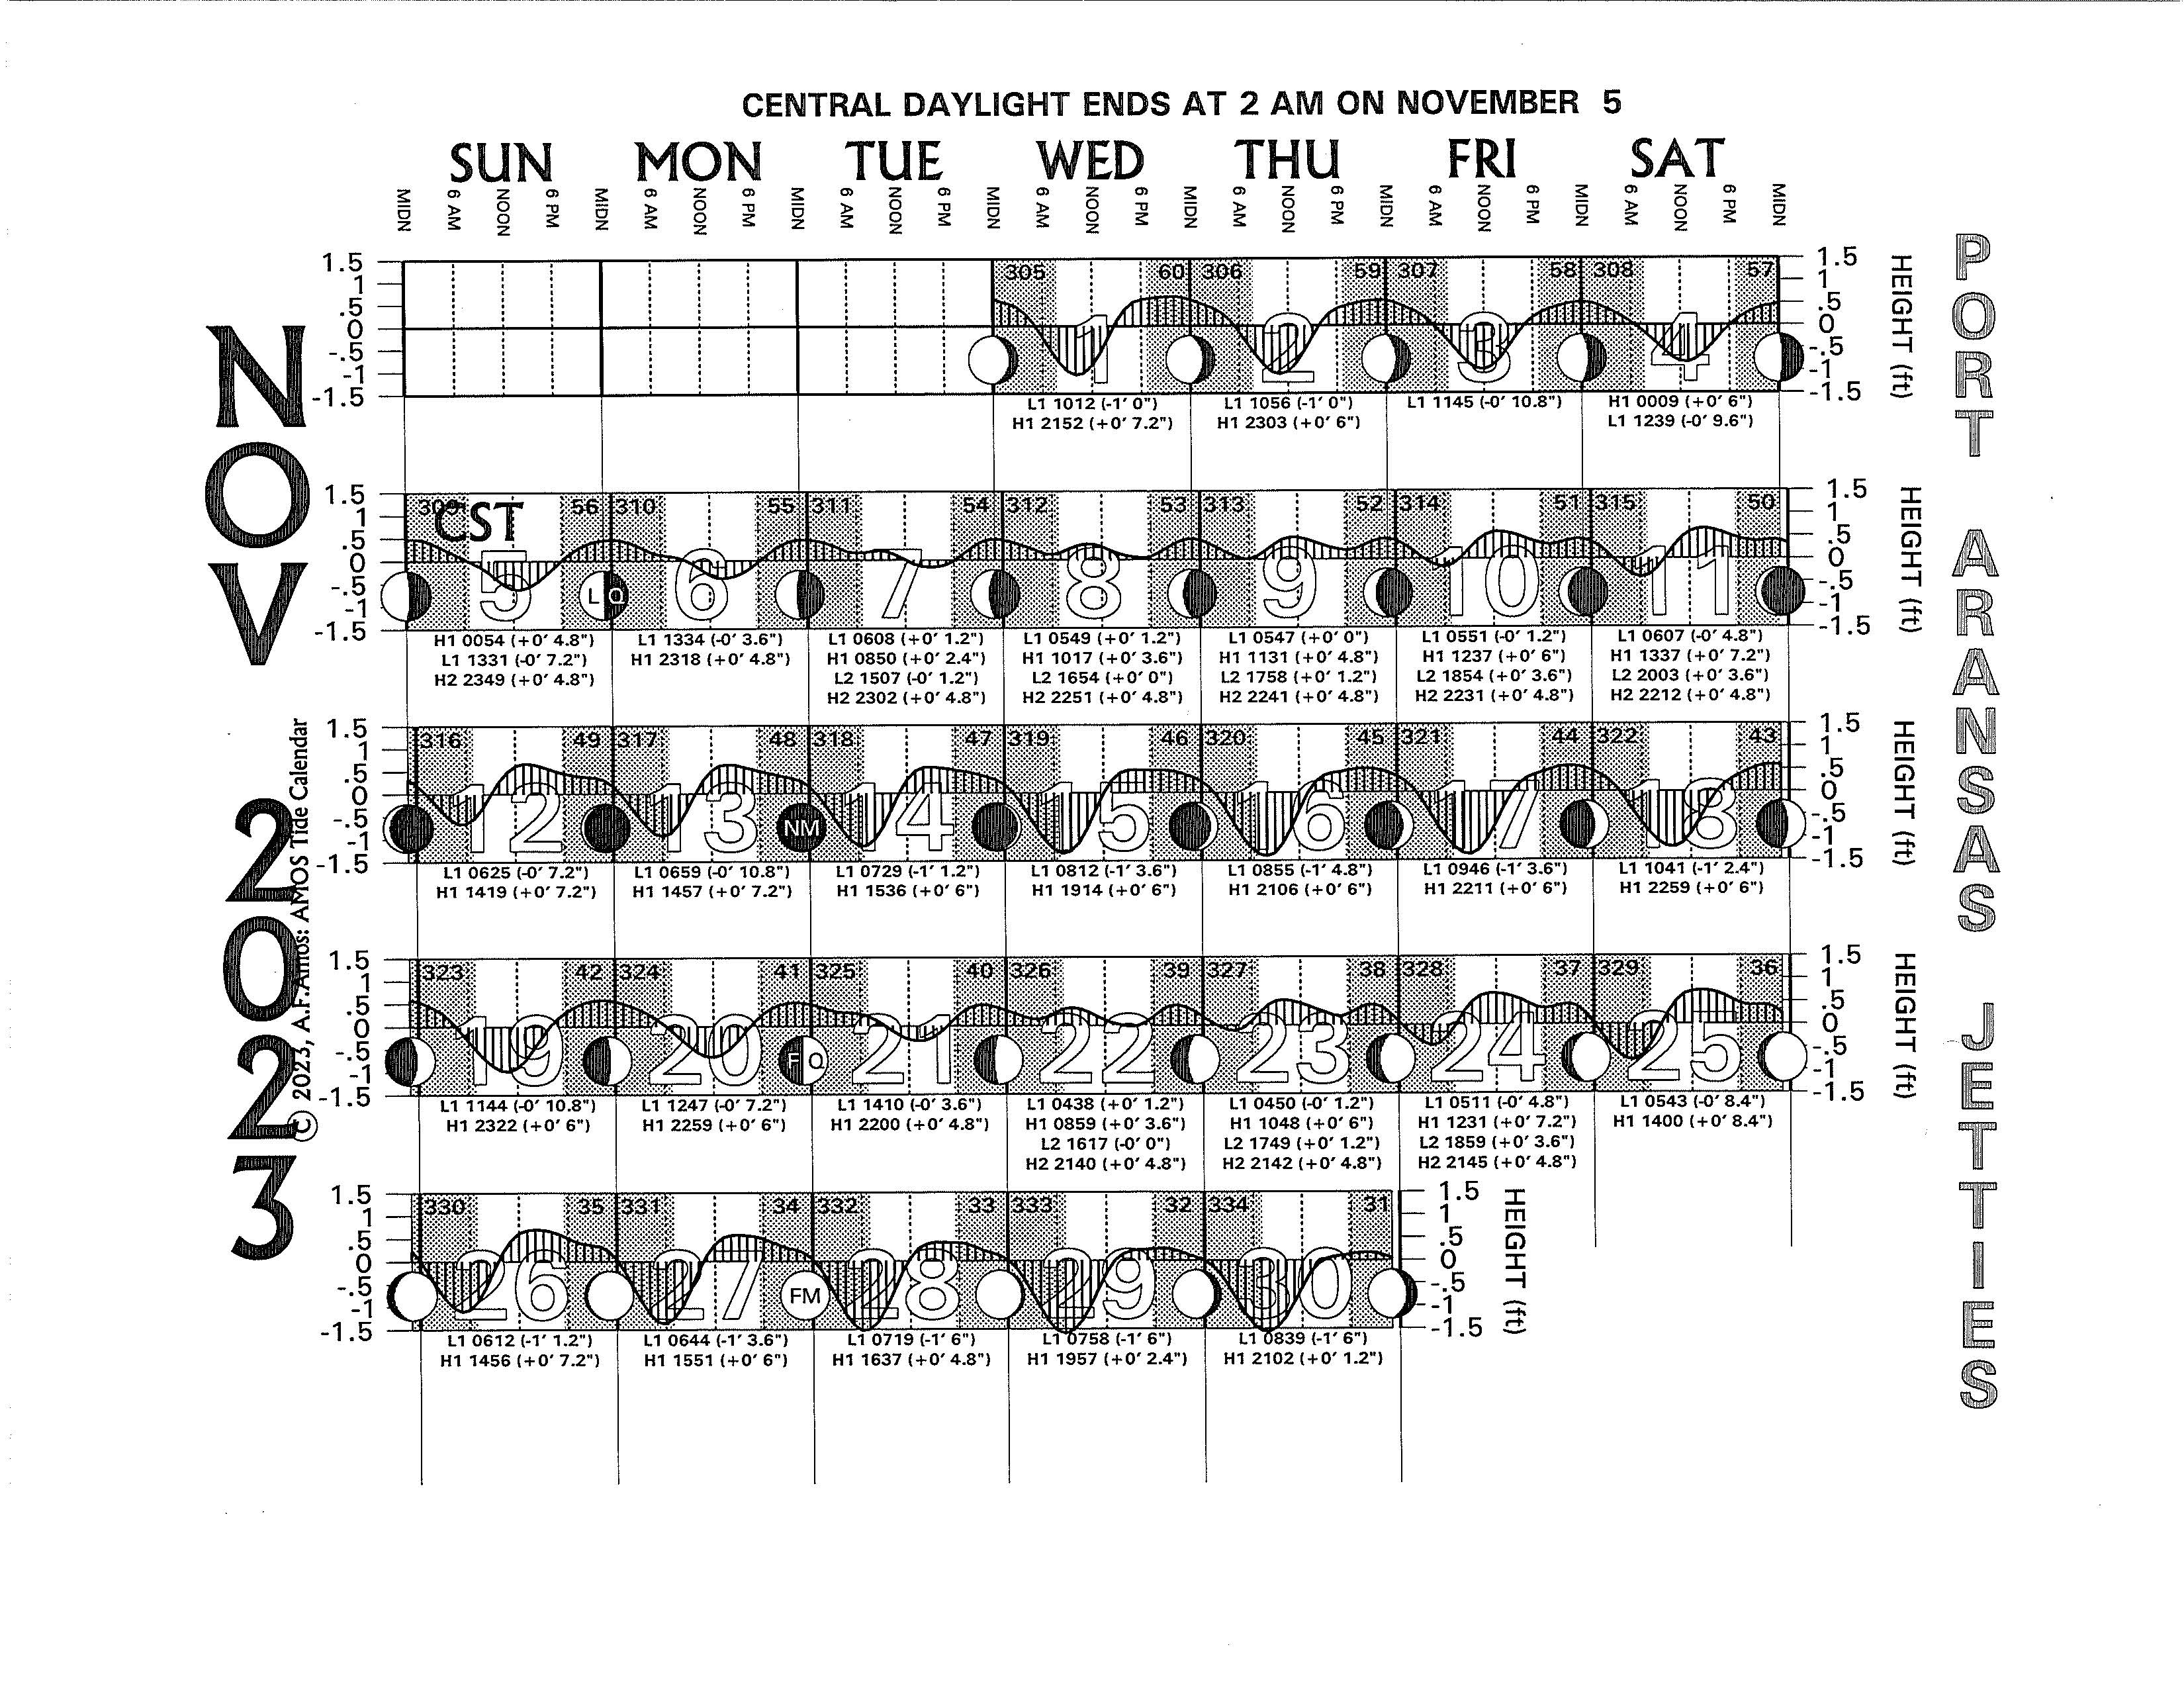
2023 Tide Charts - Texas Tides: Port Aransas Jetties
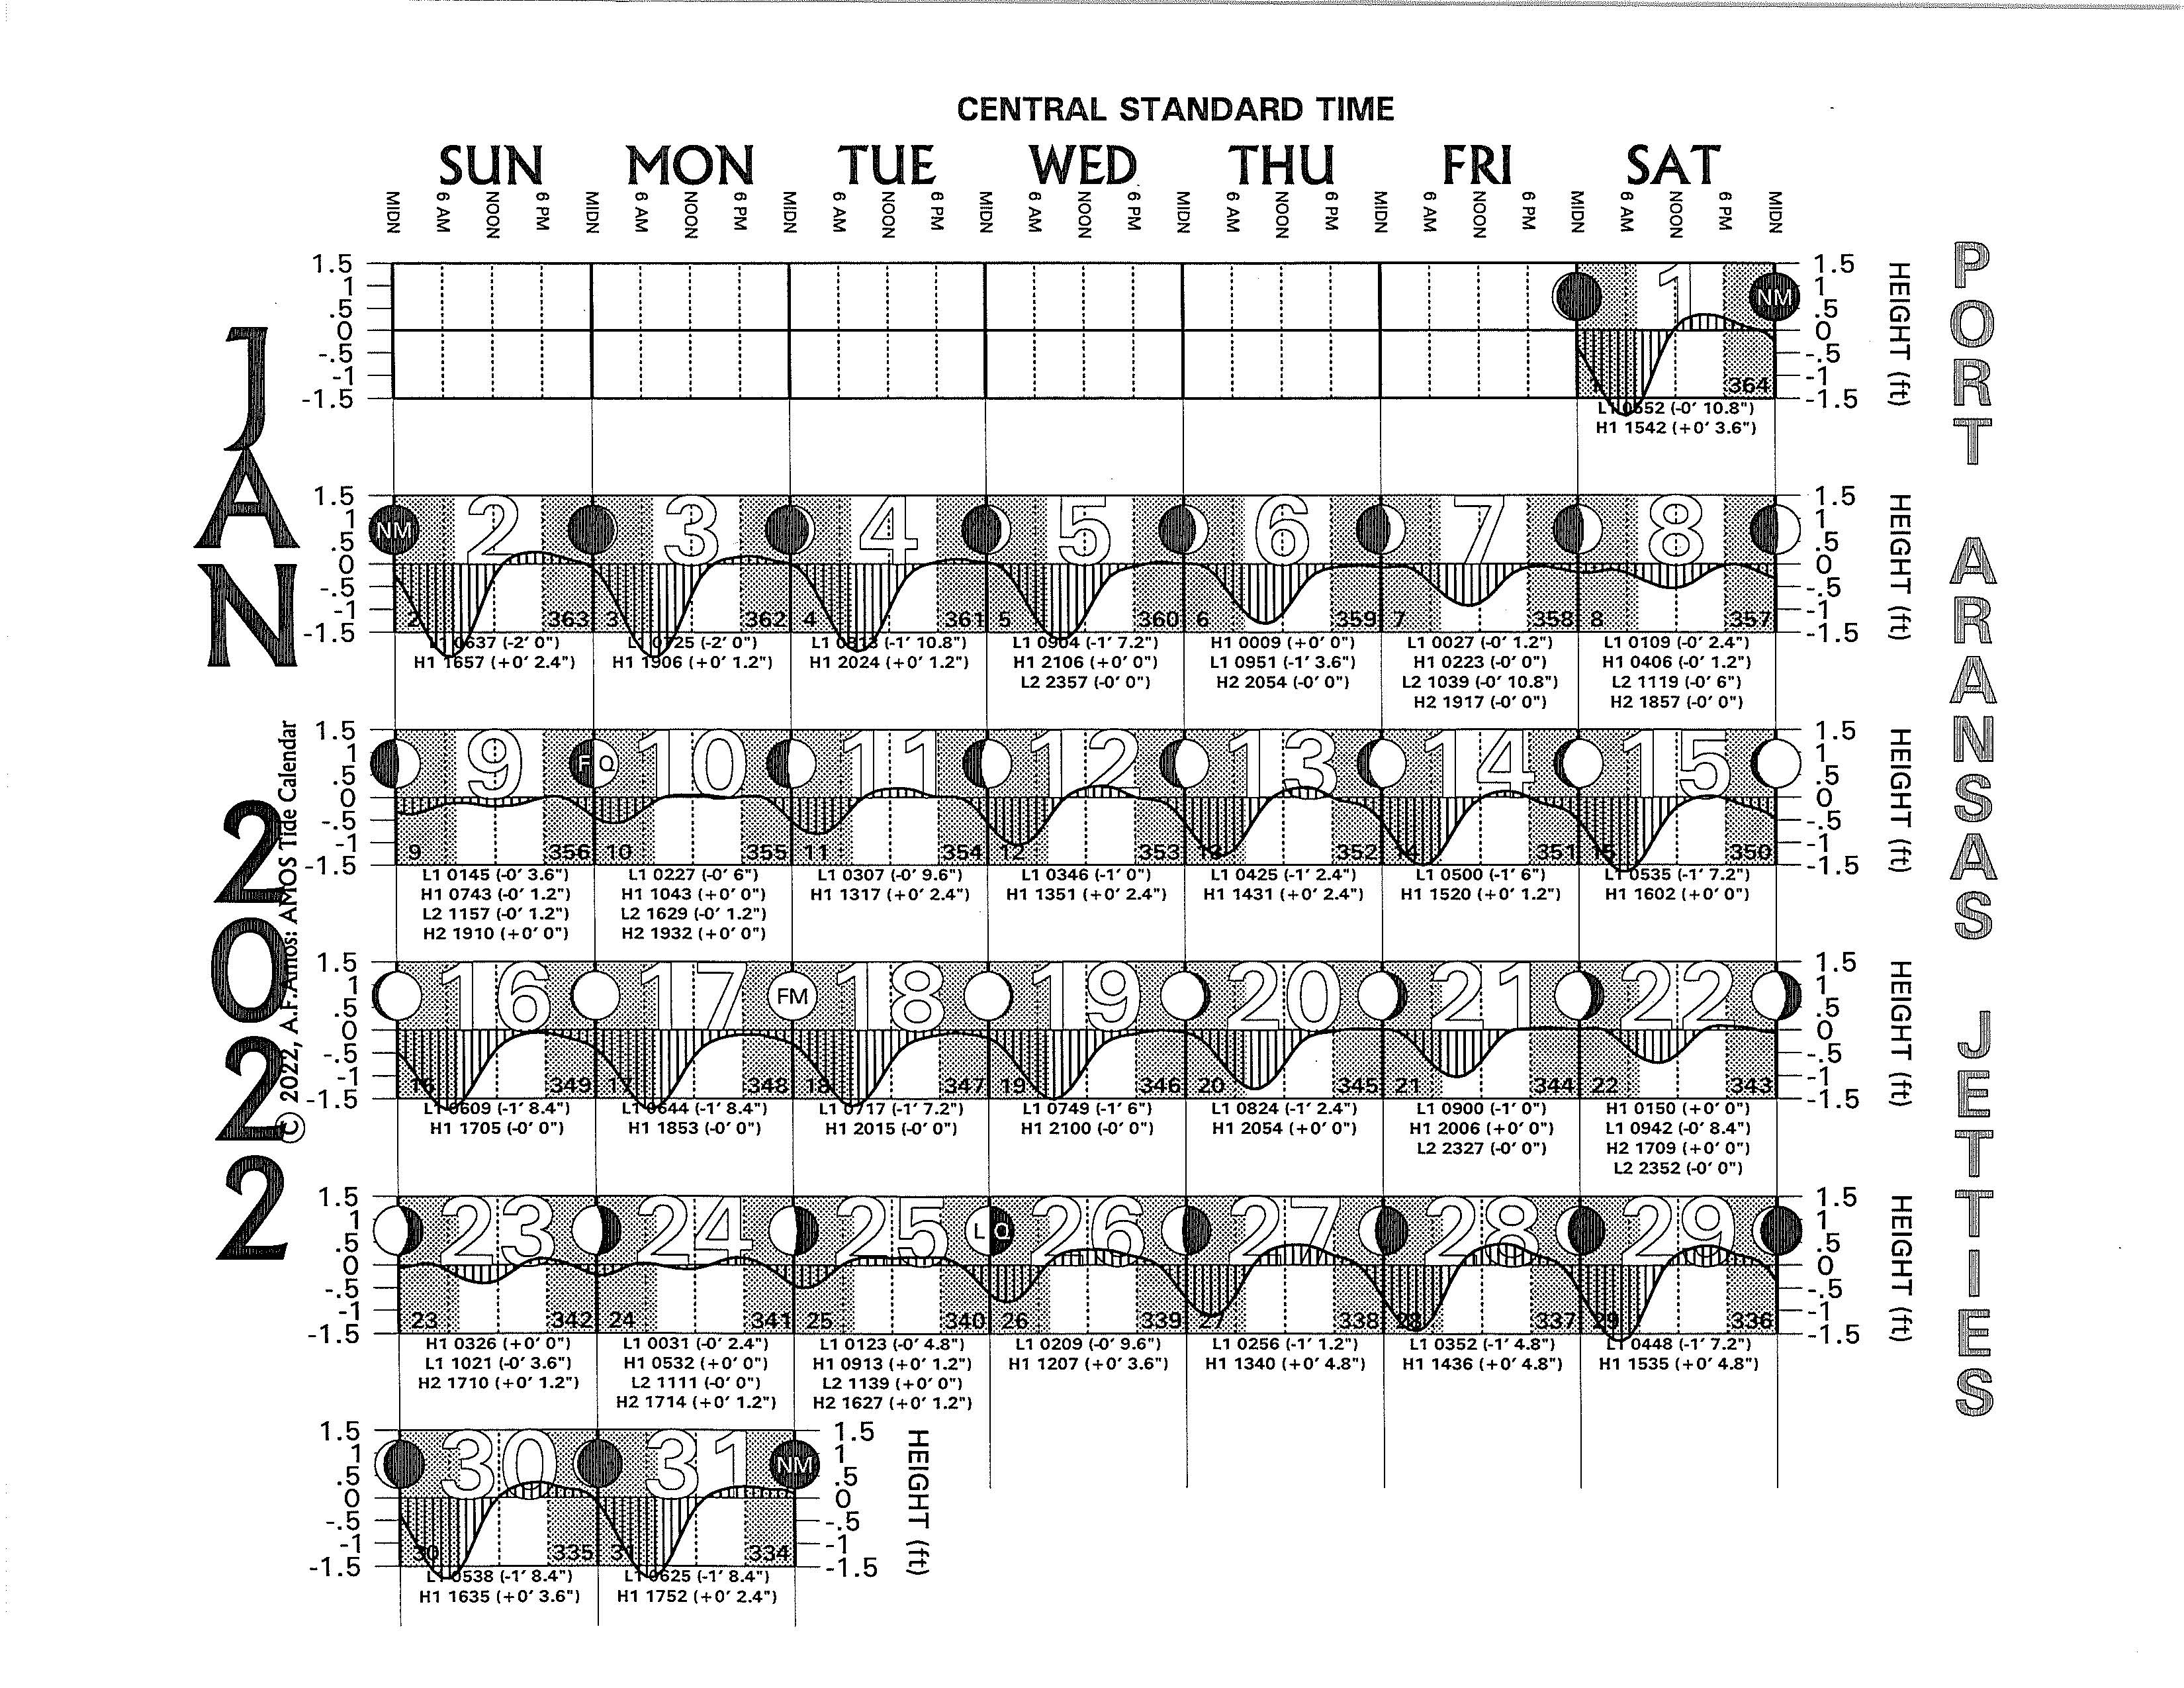
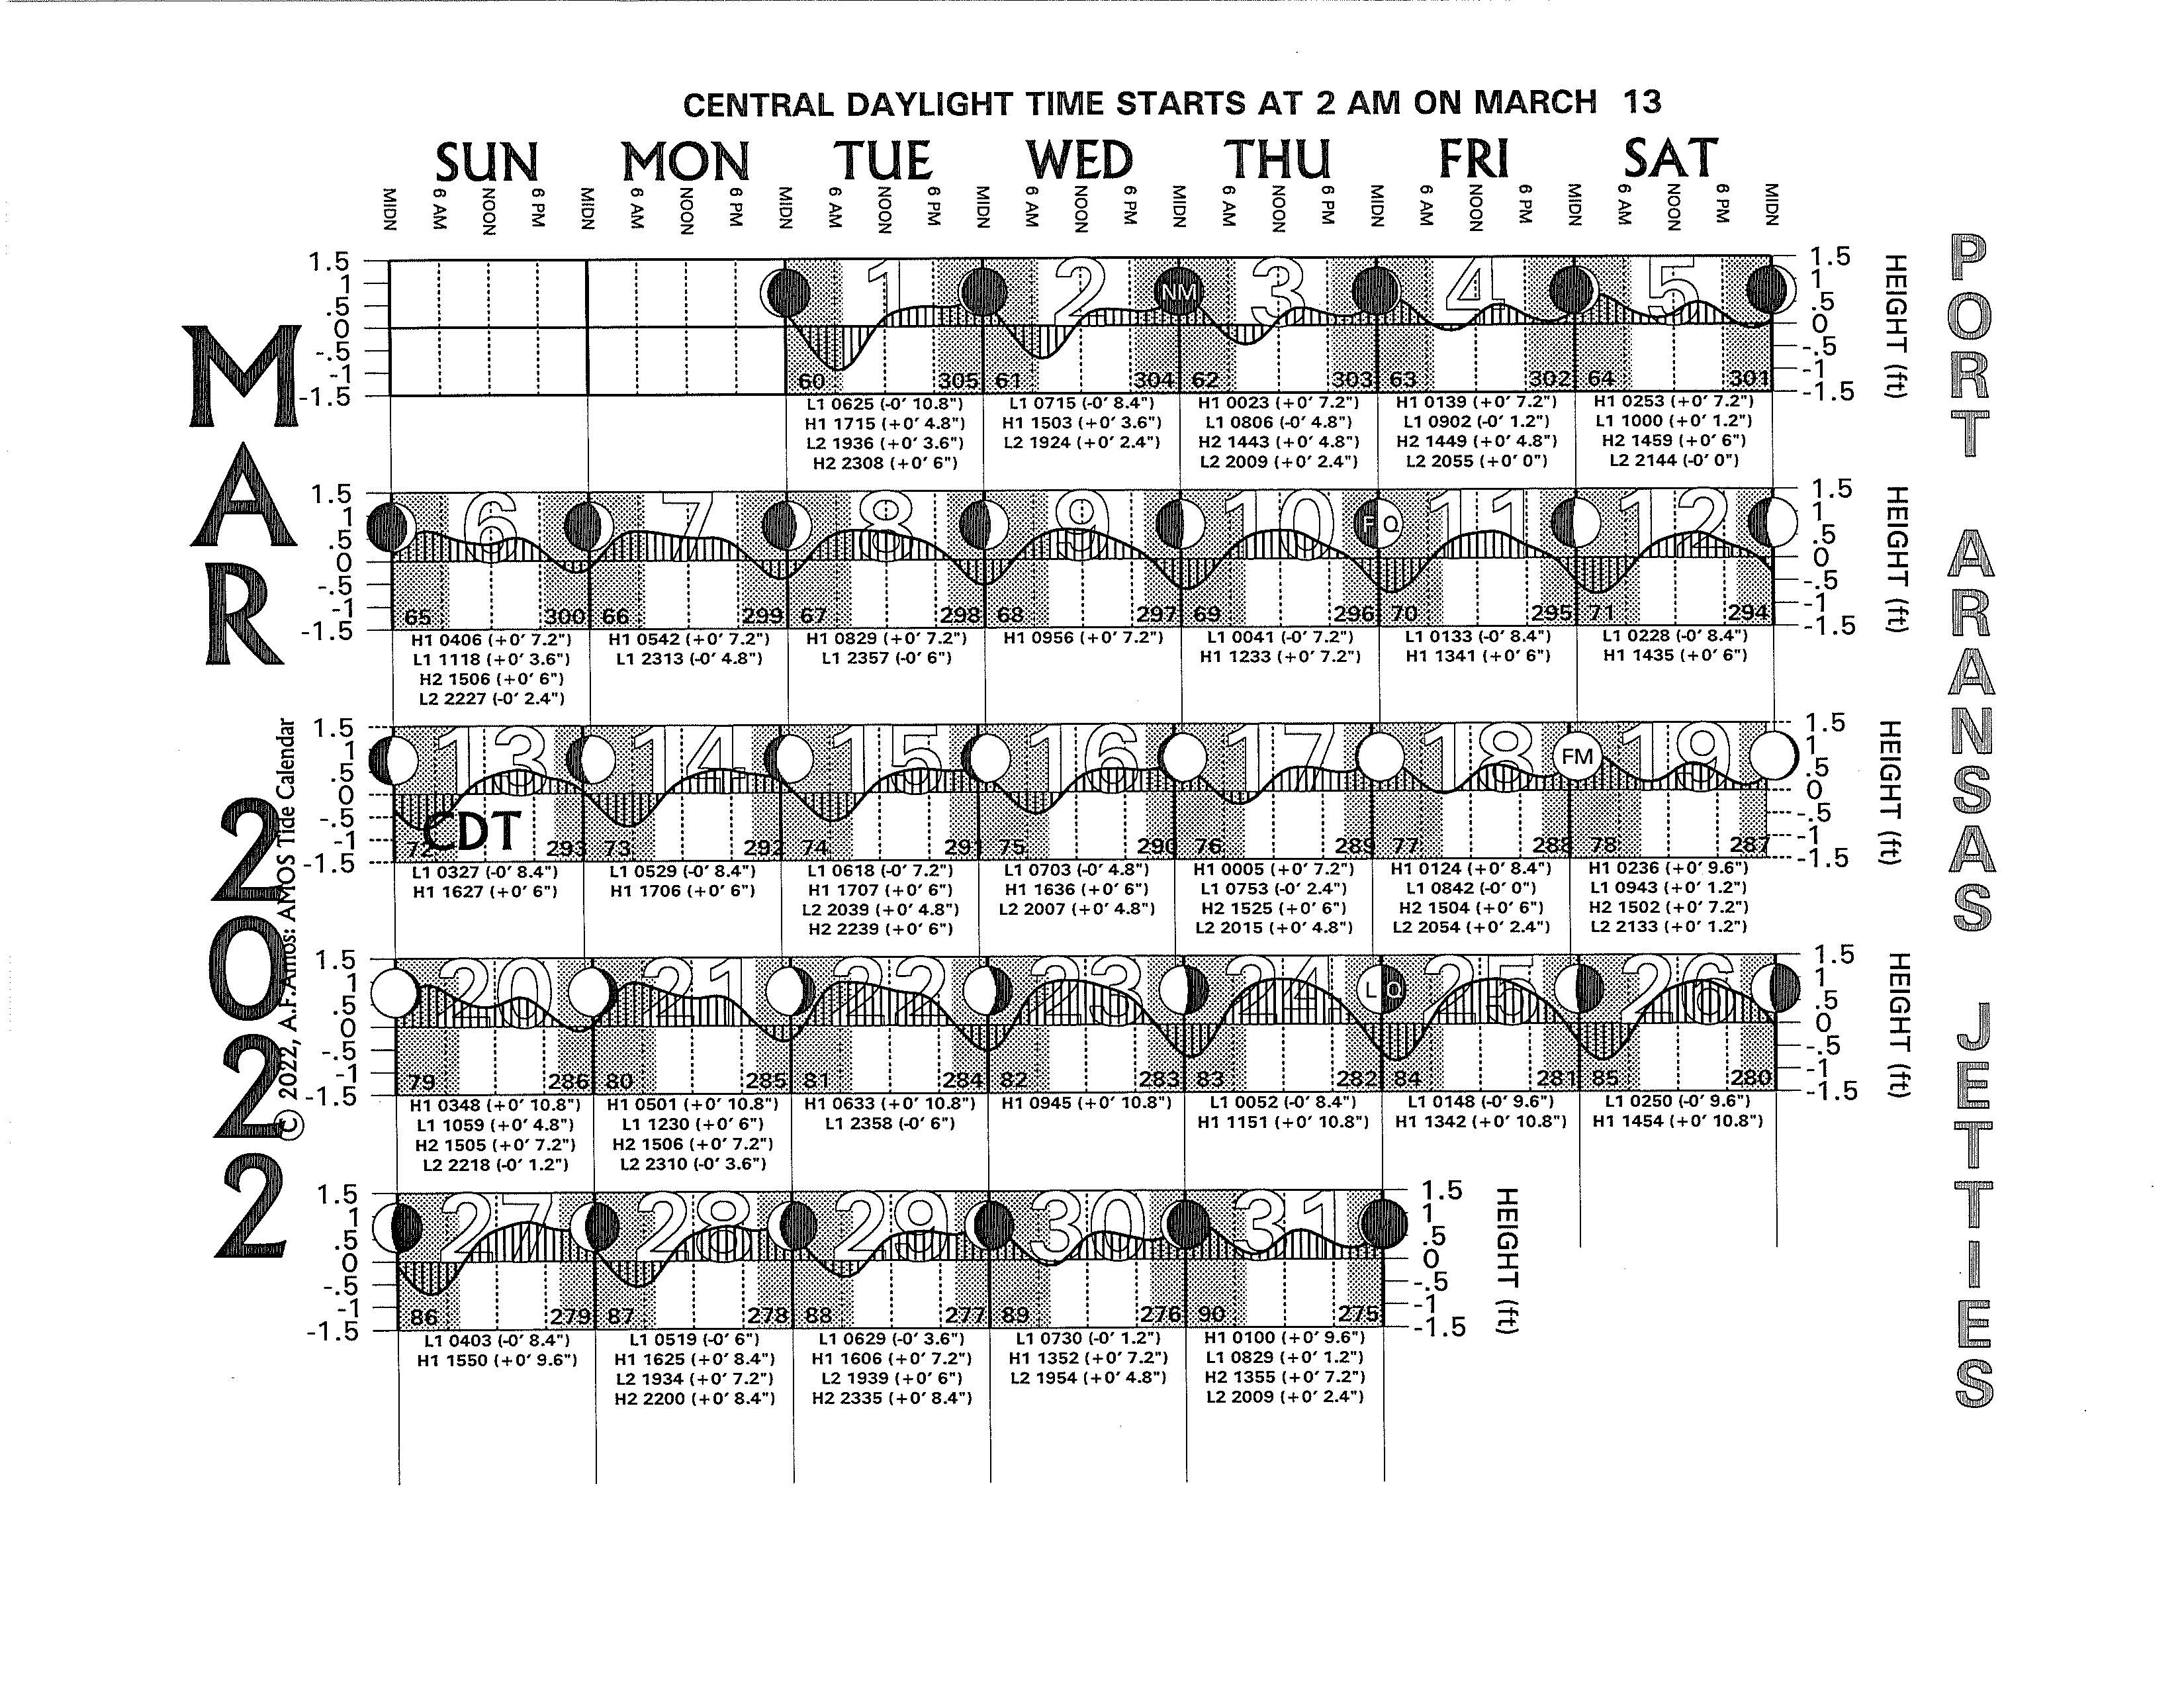
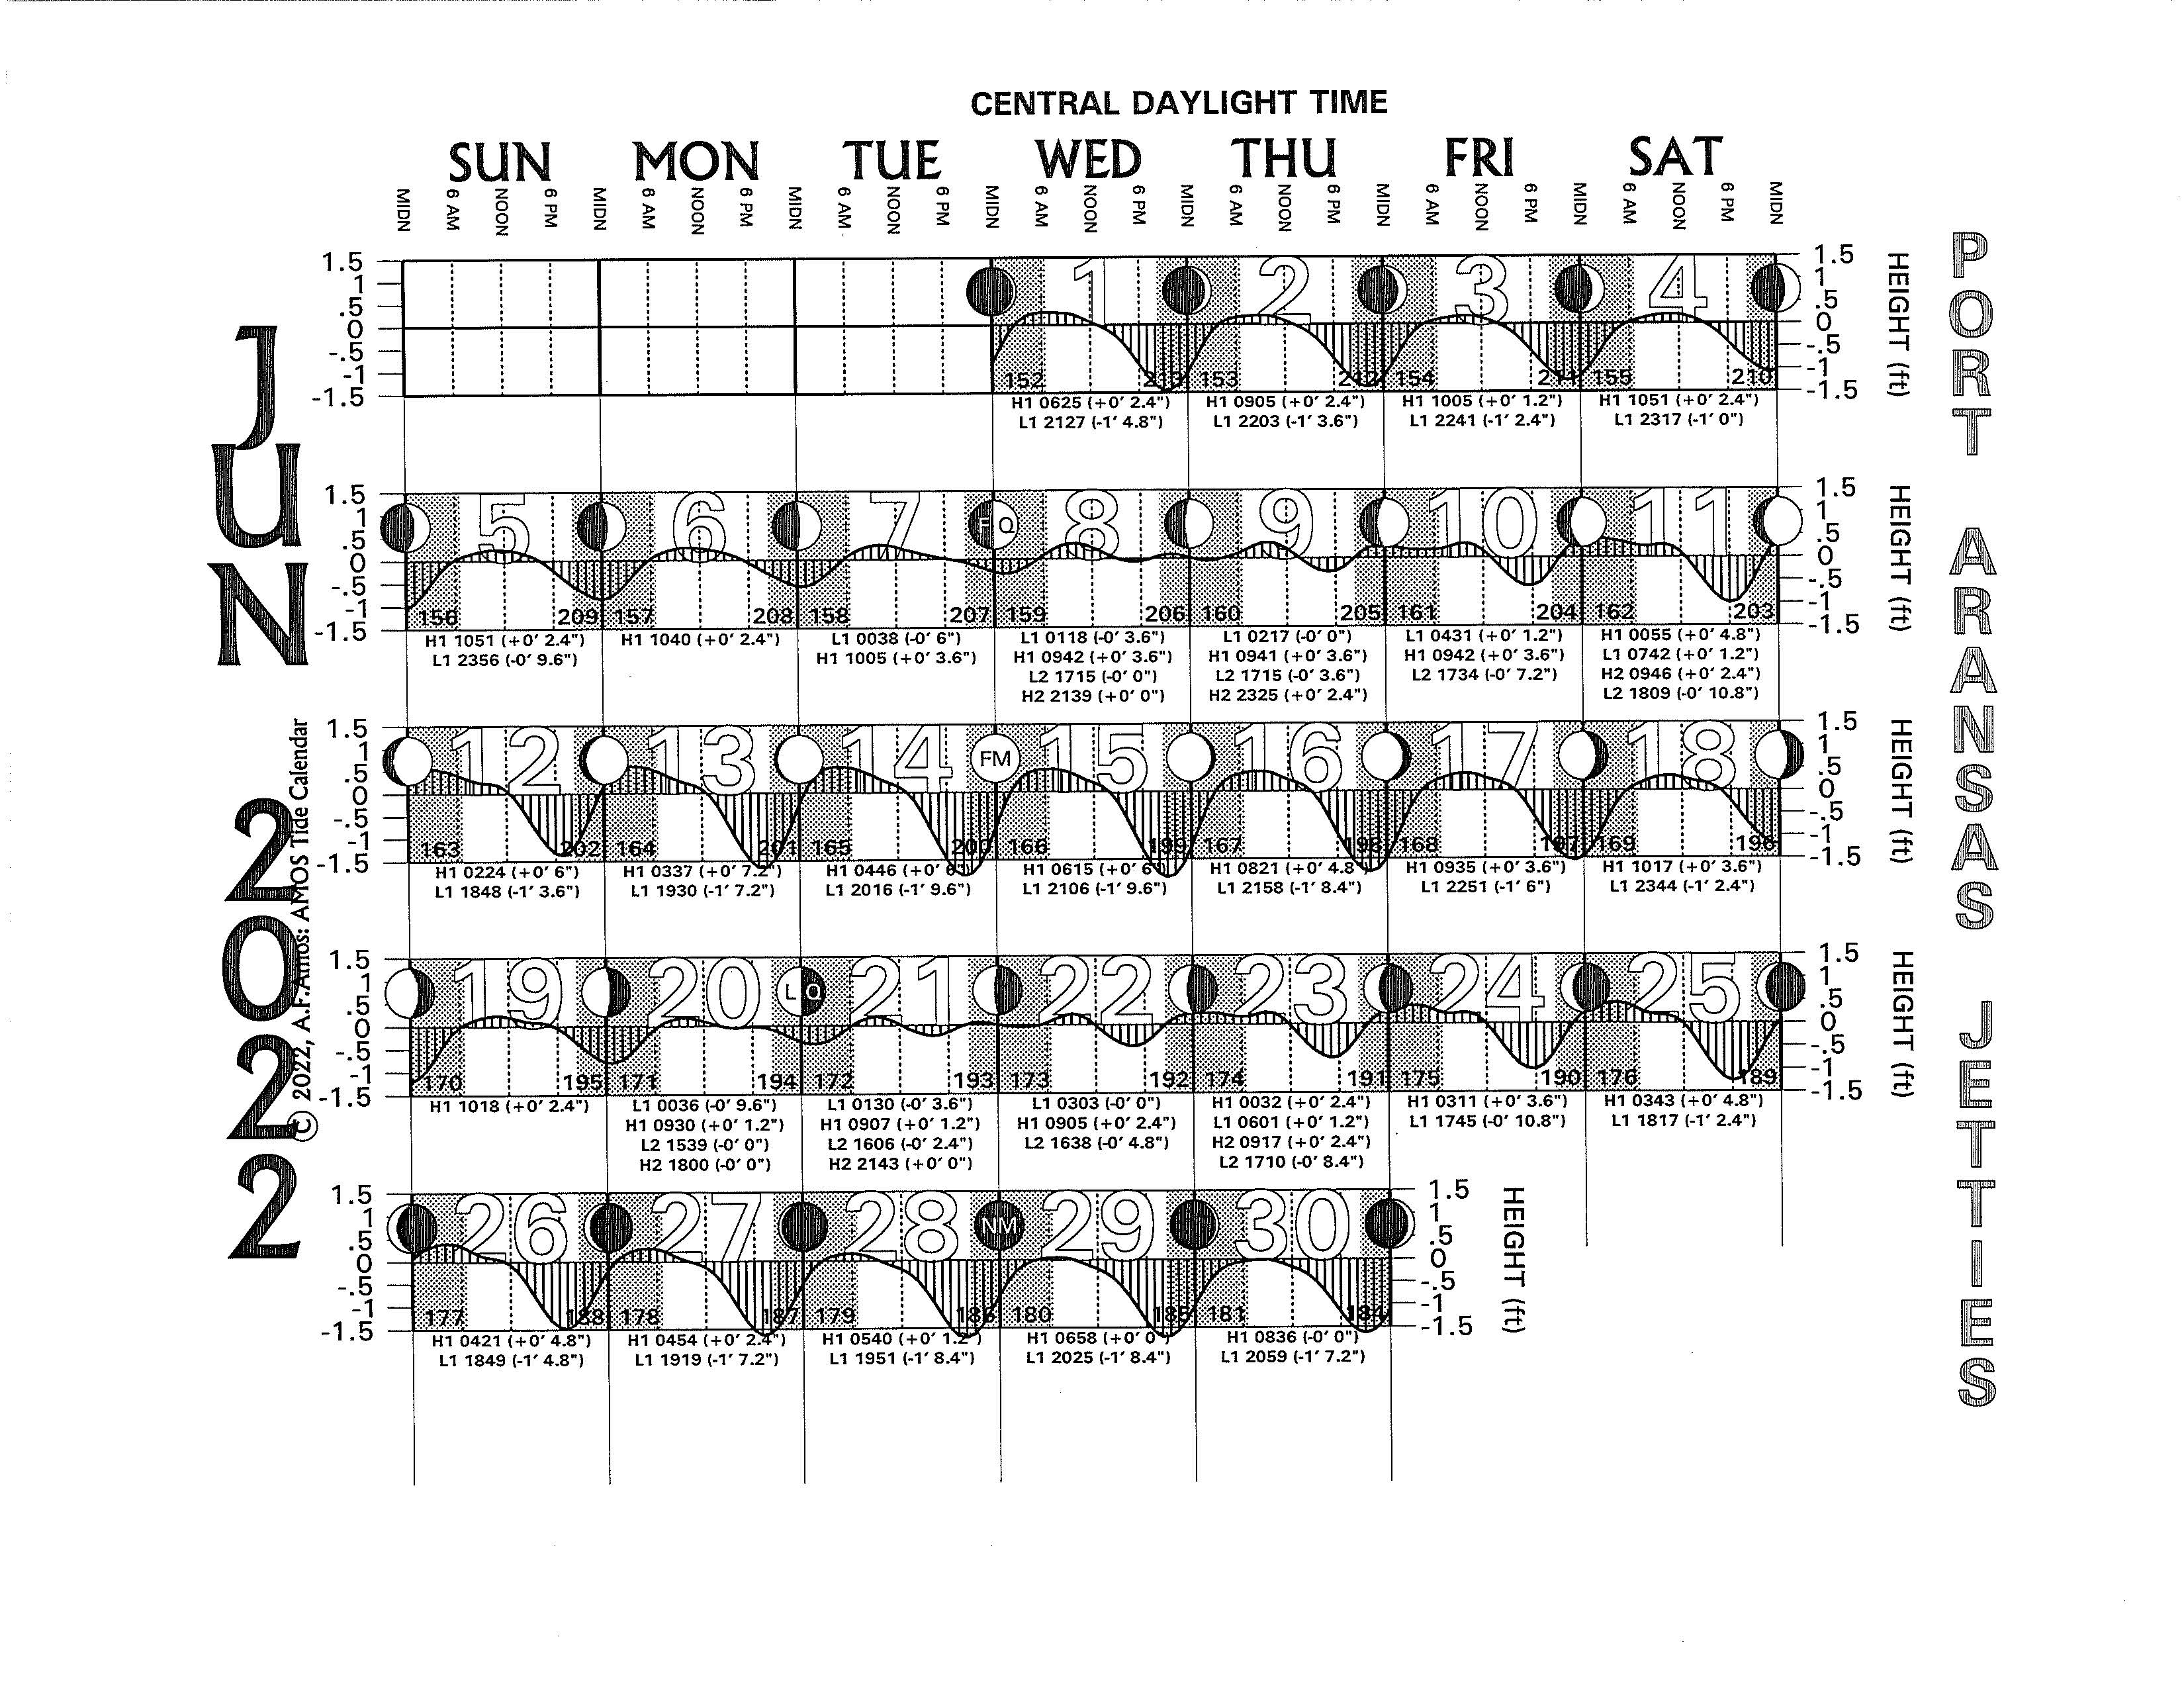
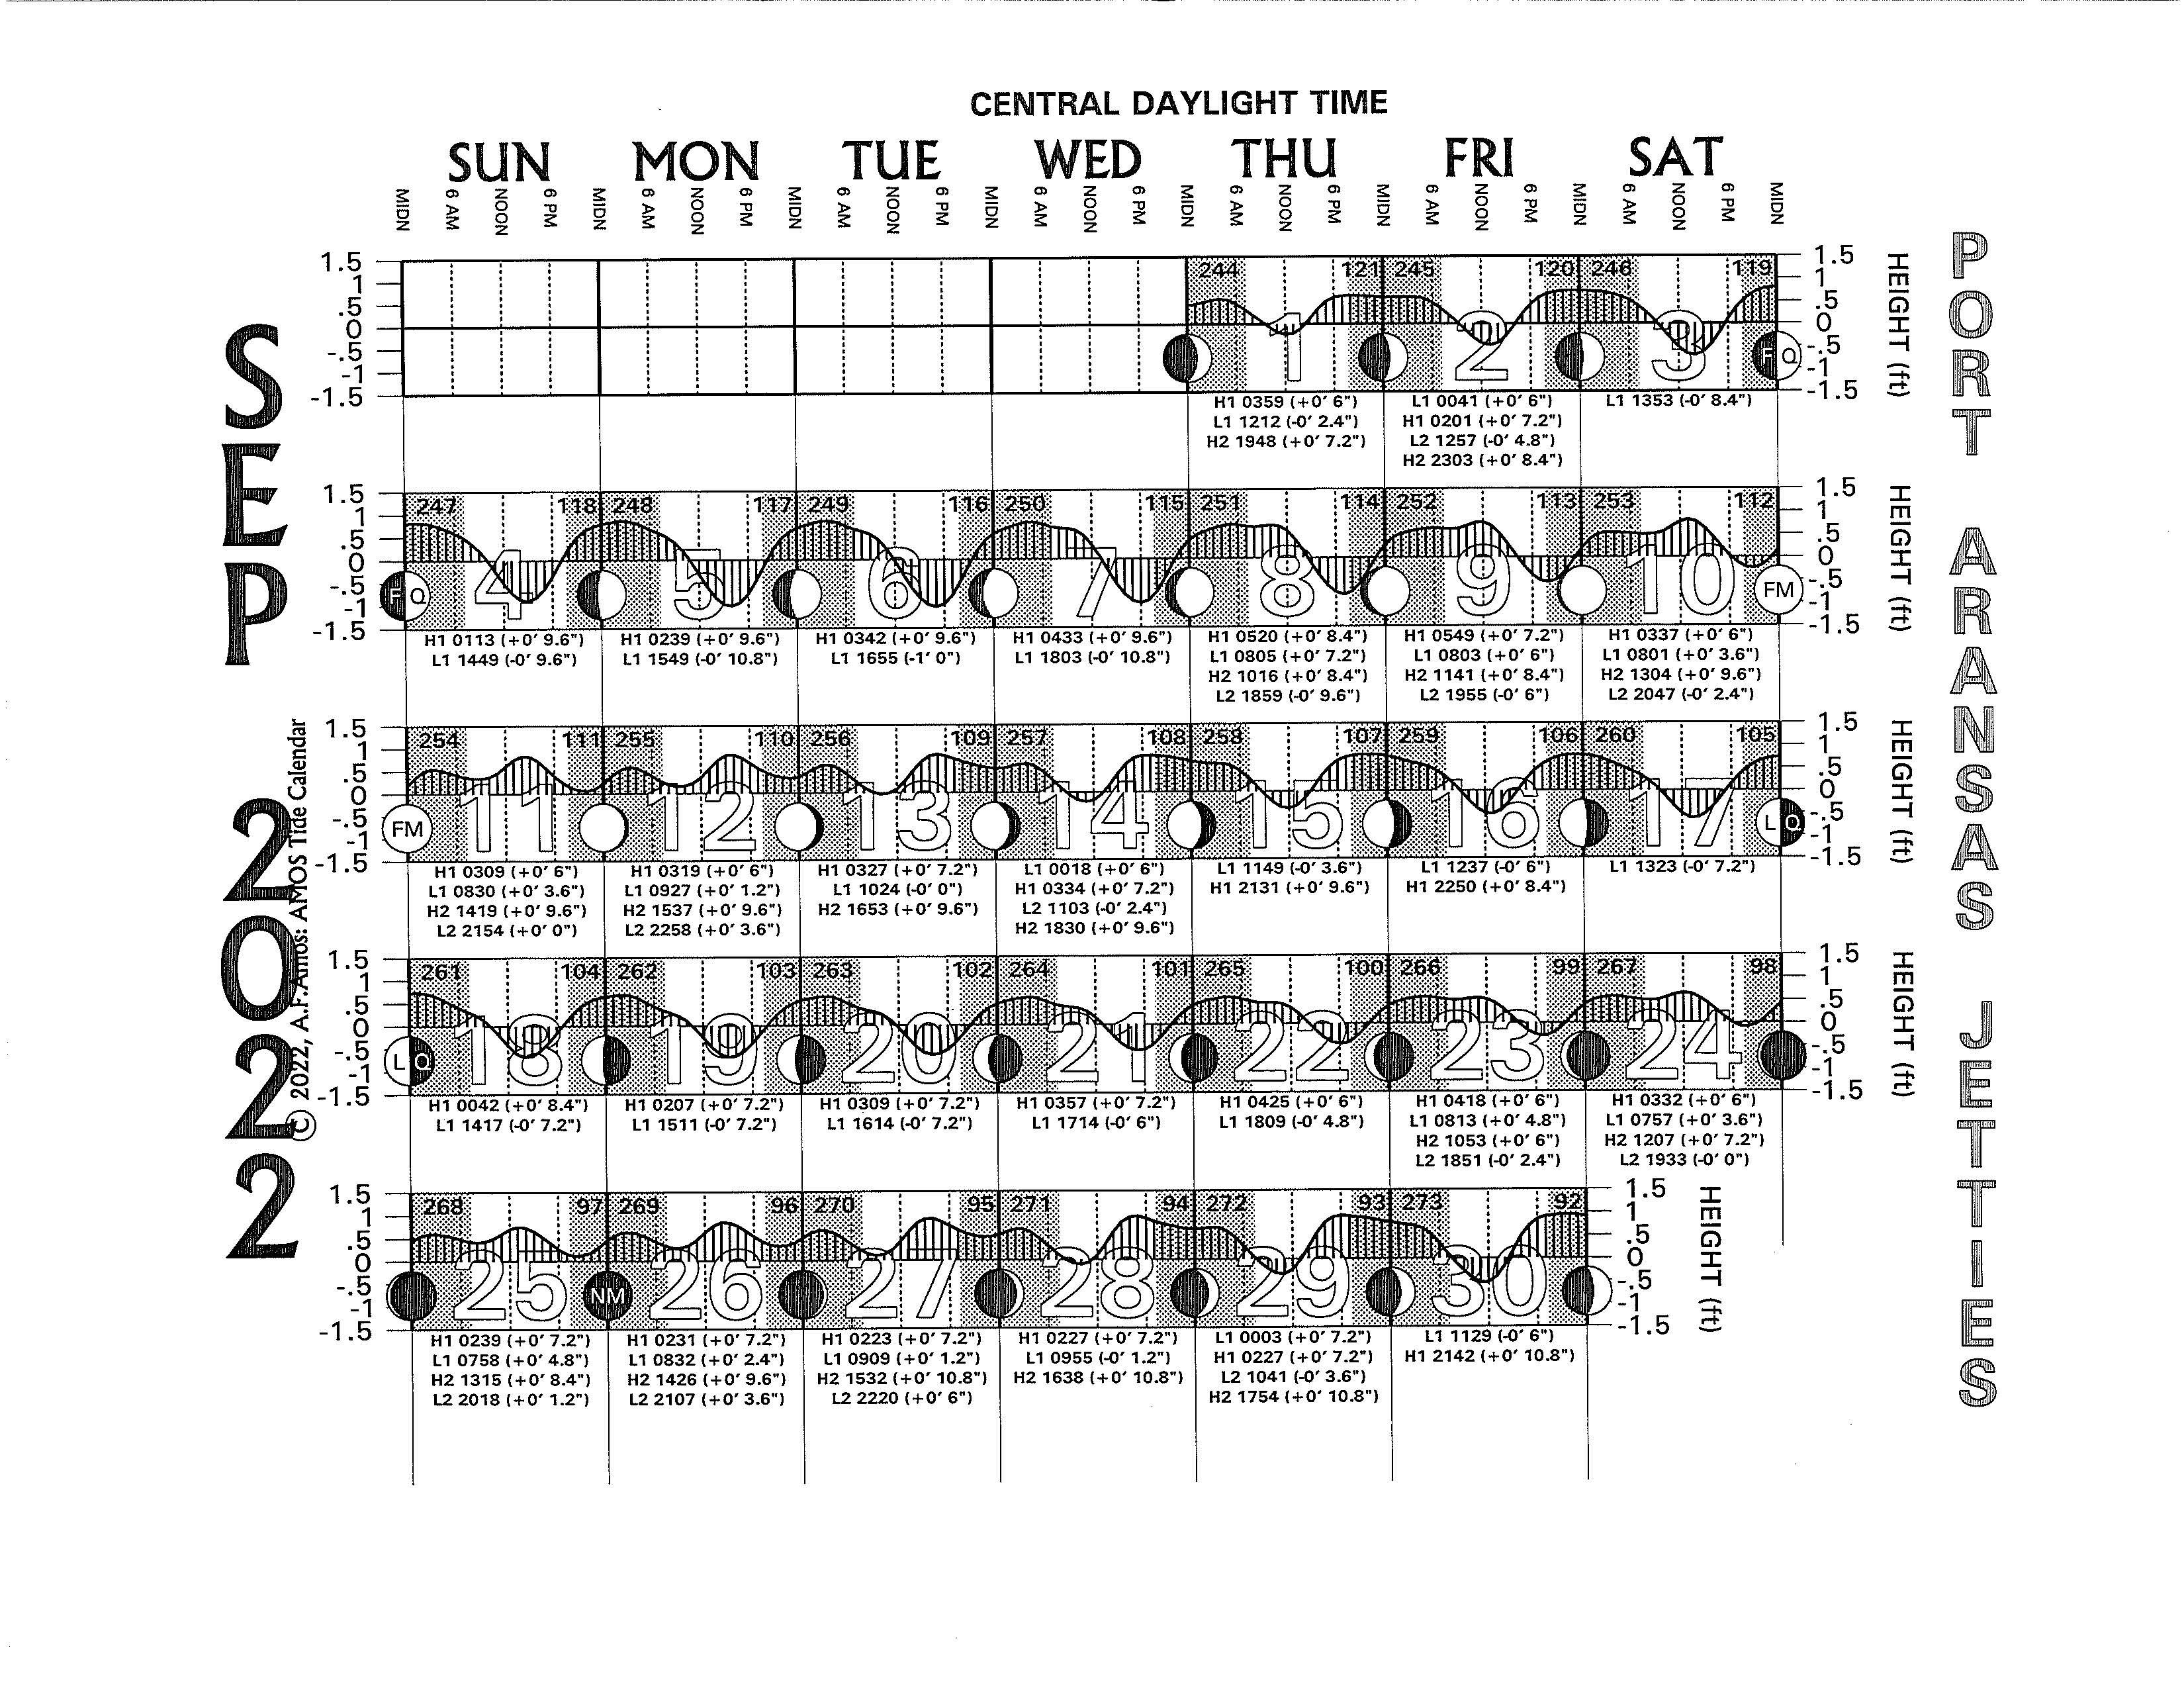
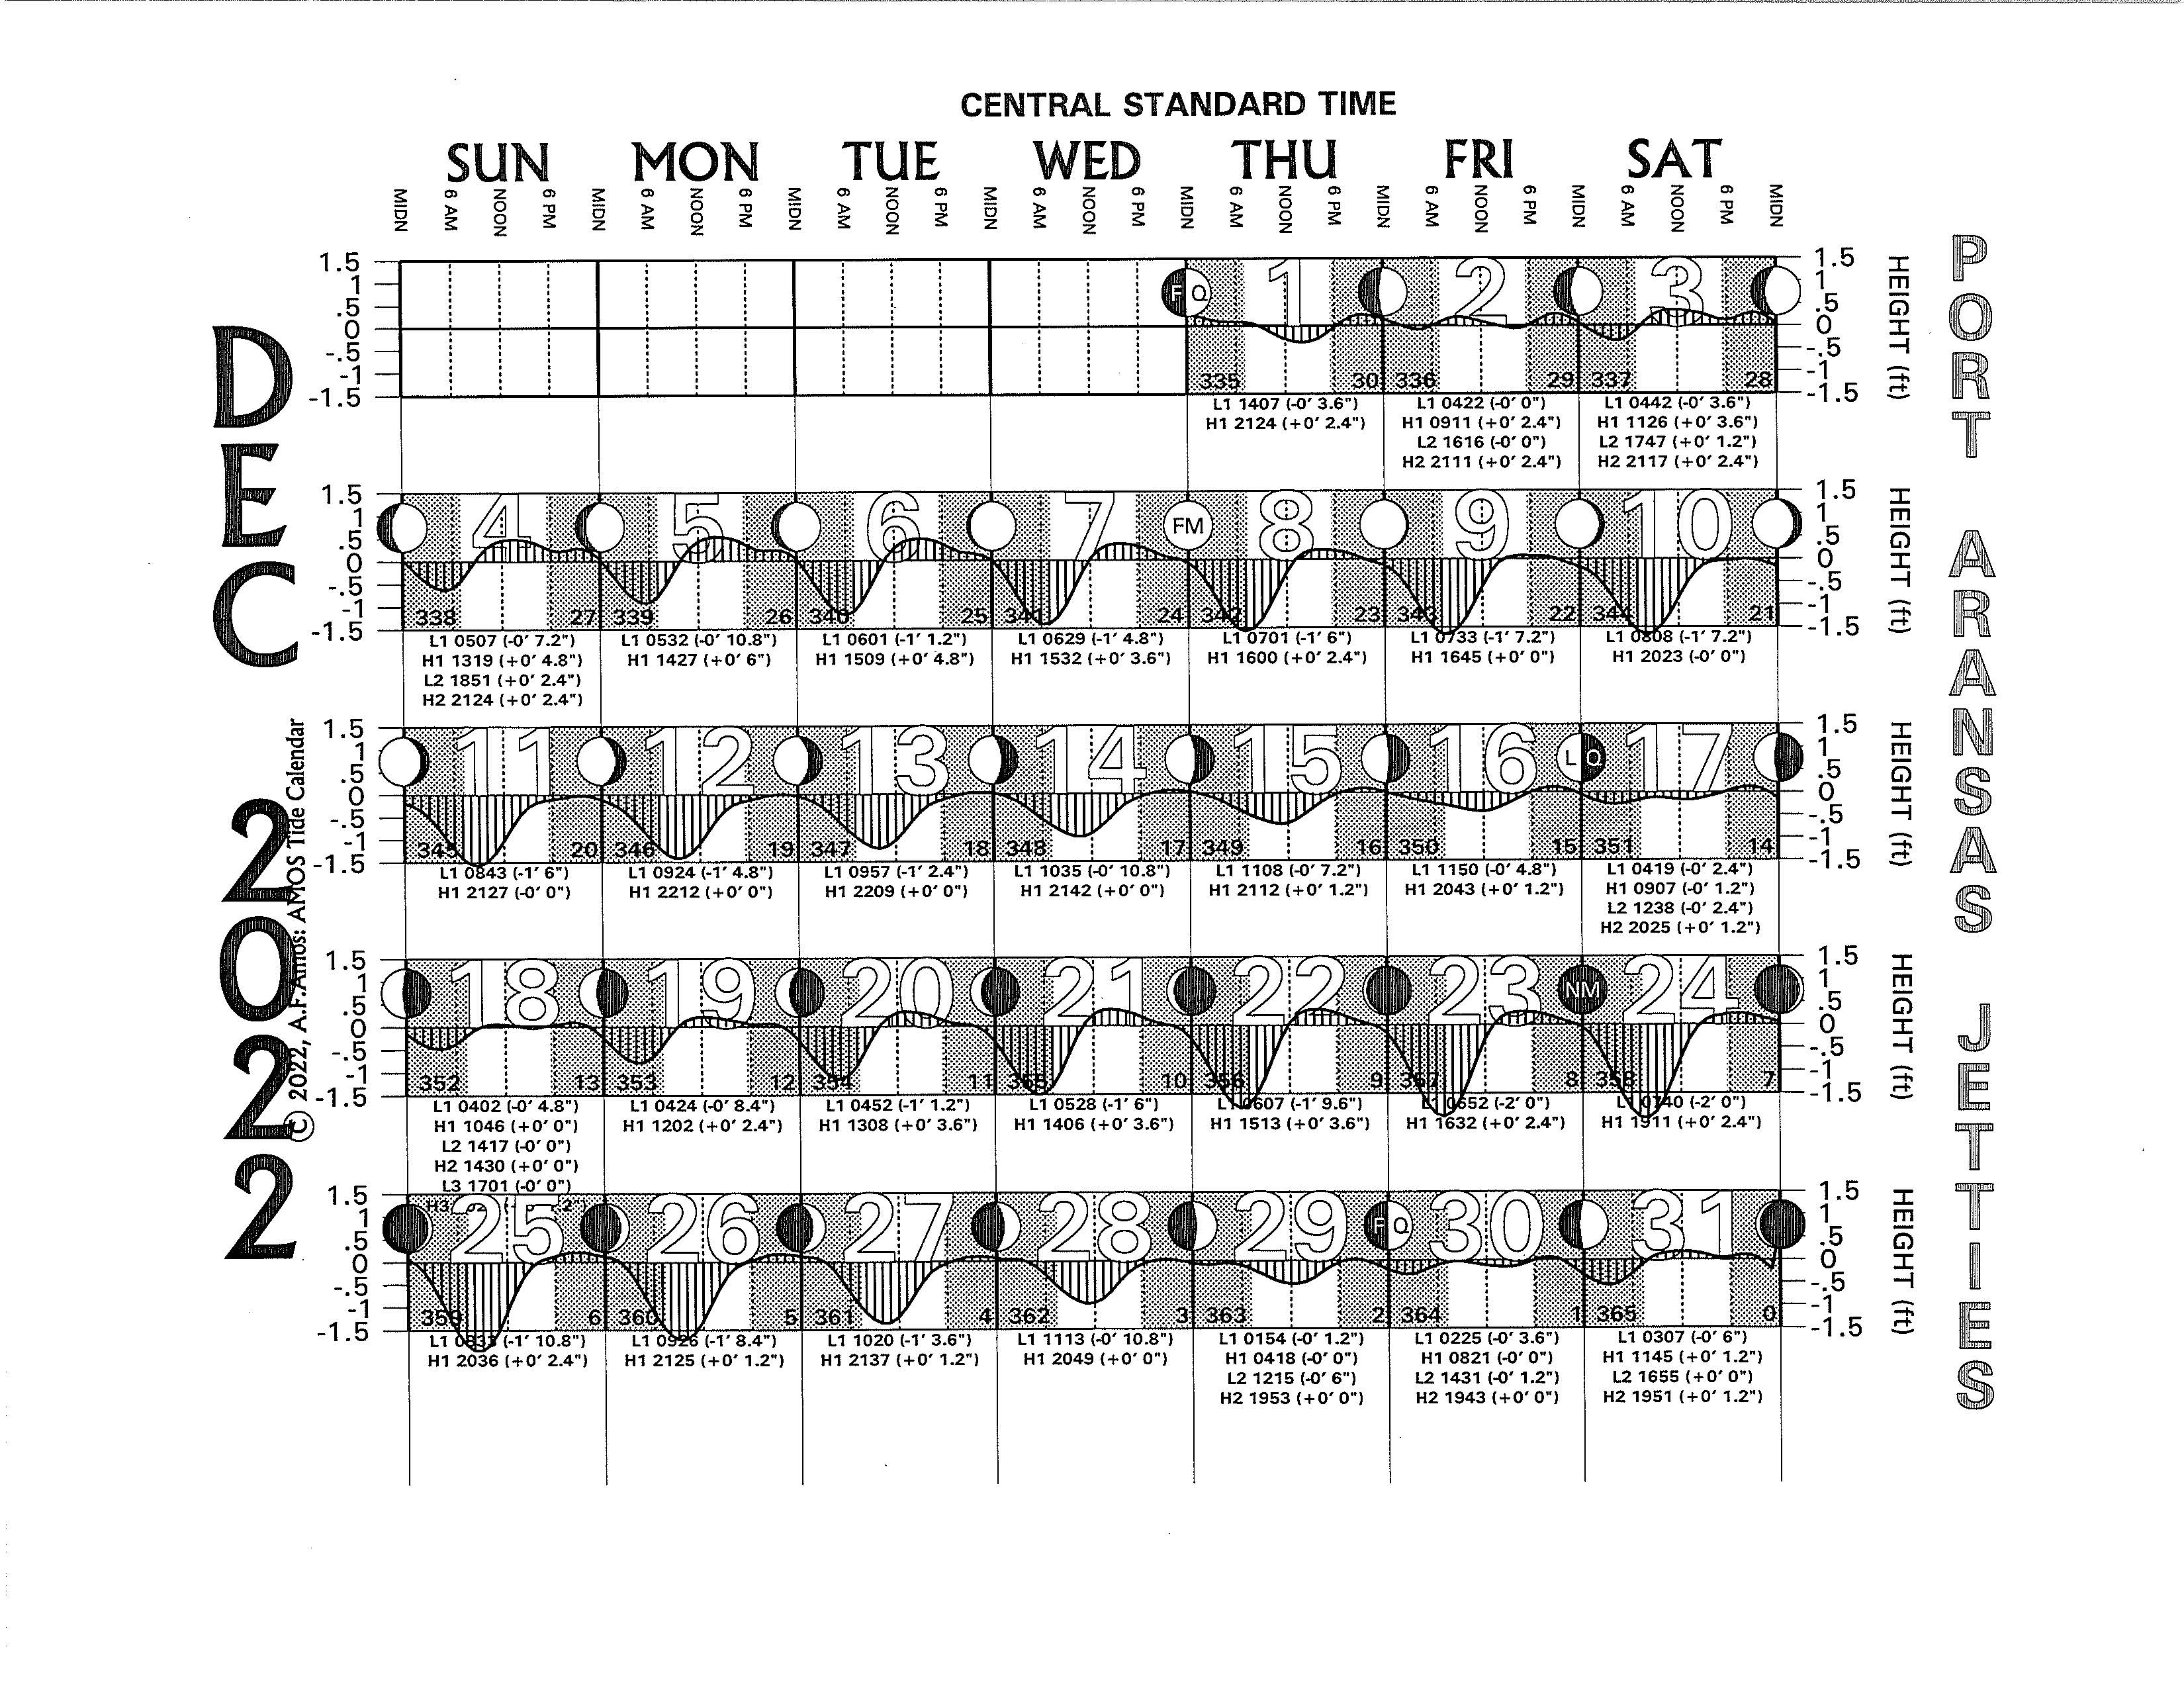
2022 Tide Charts - Texas Tides: Port Aransas Jetties
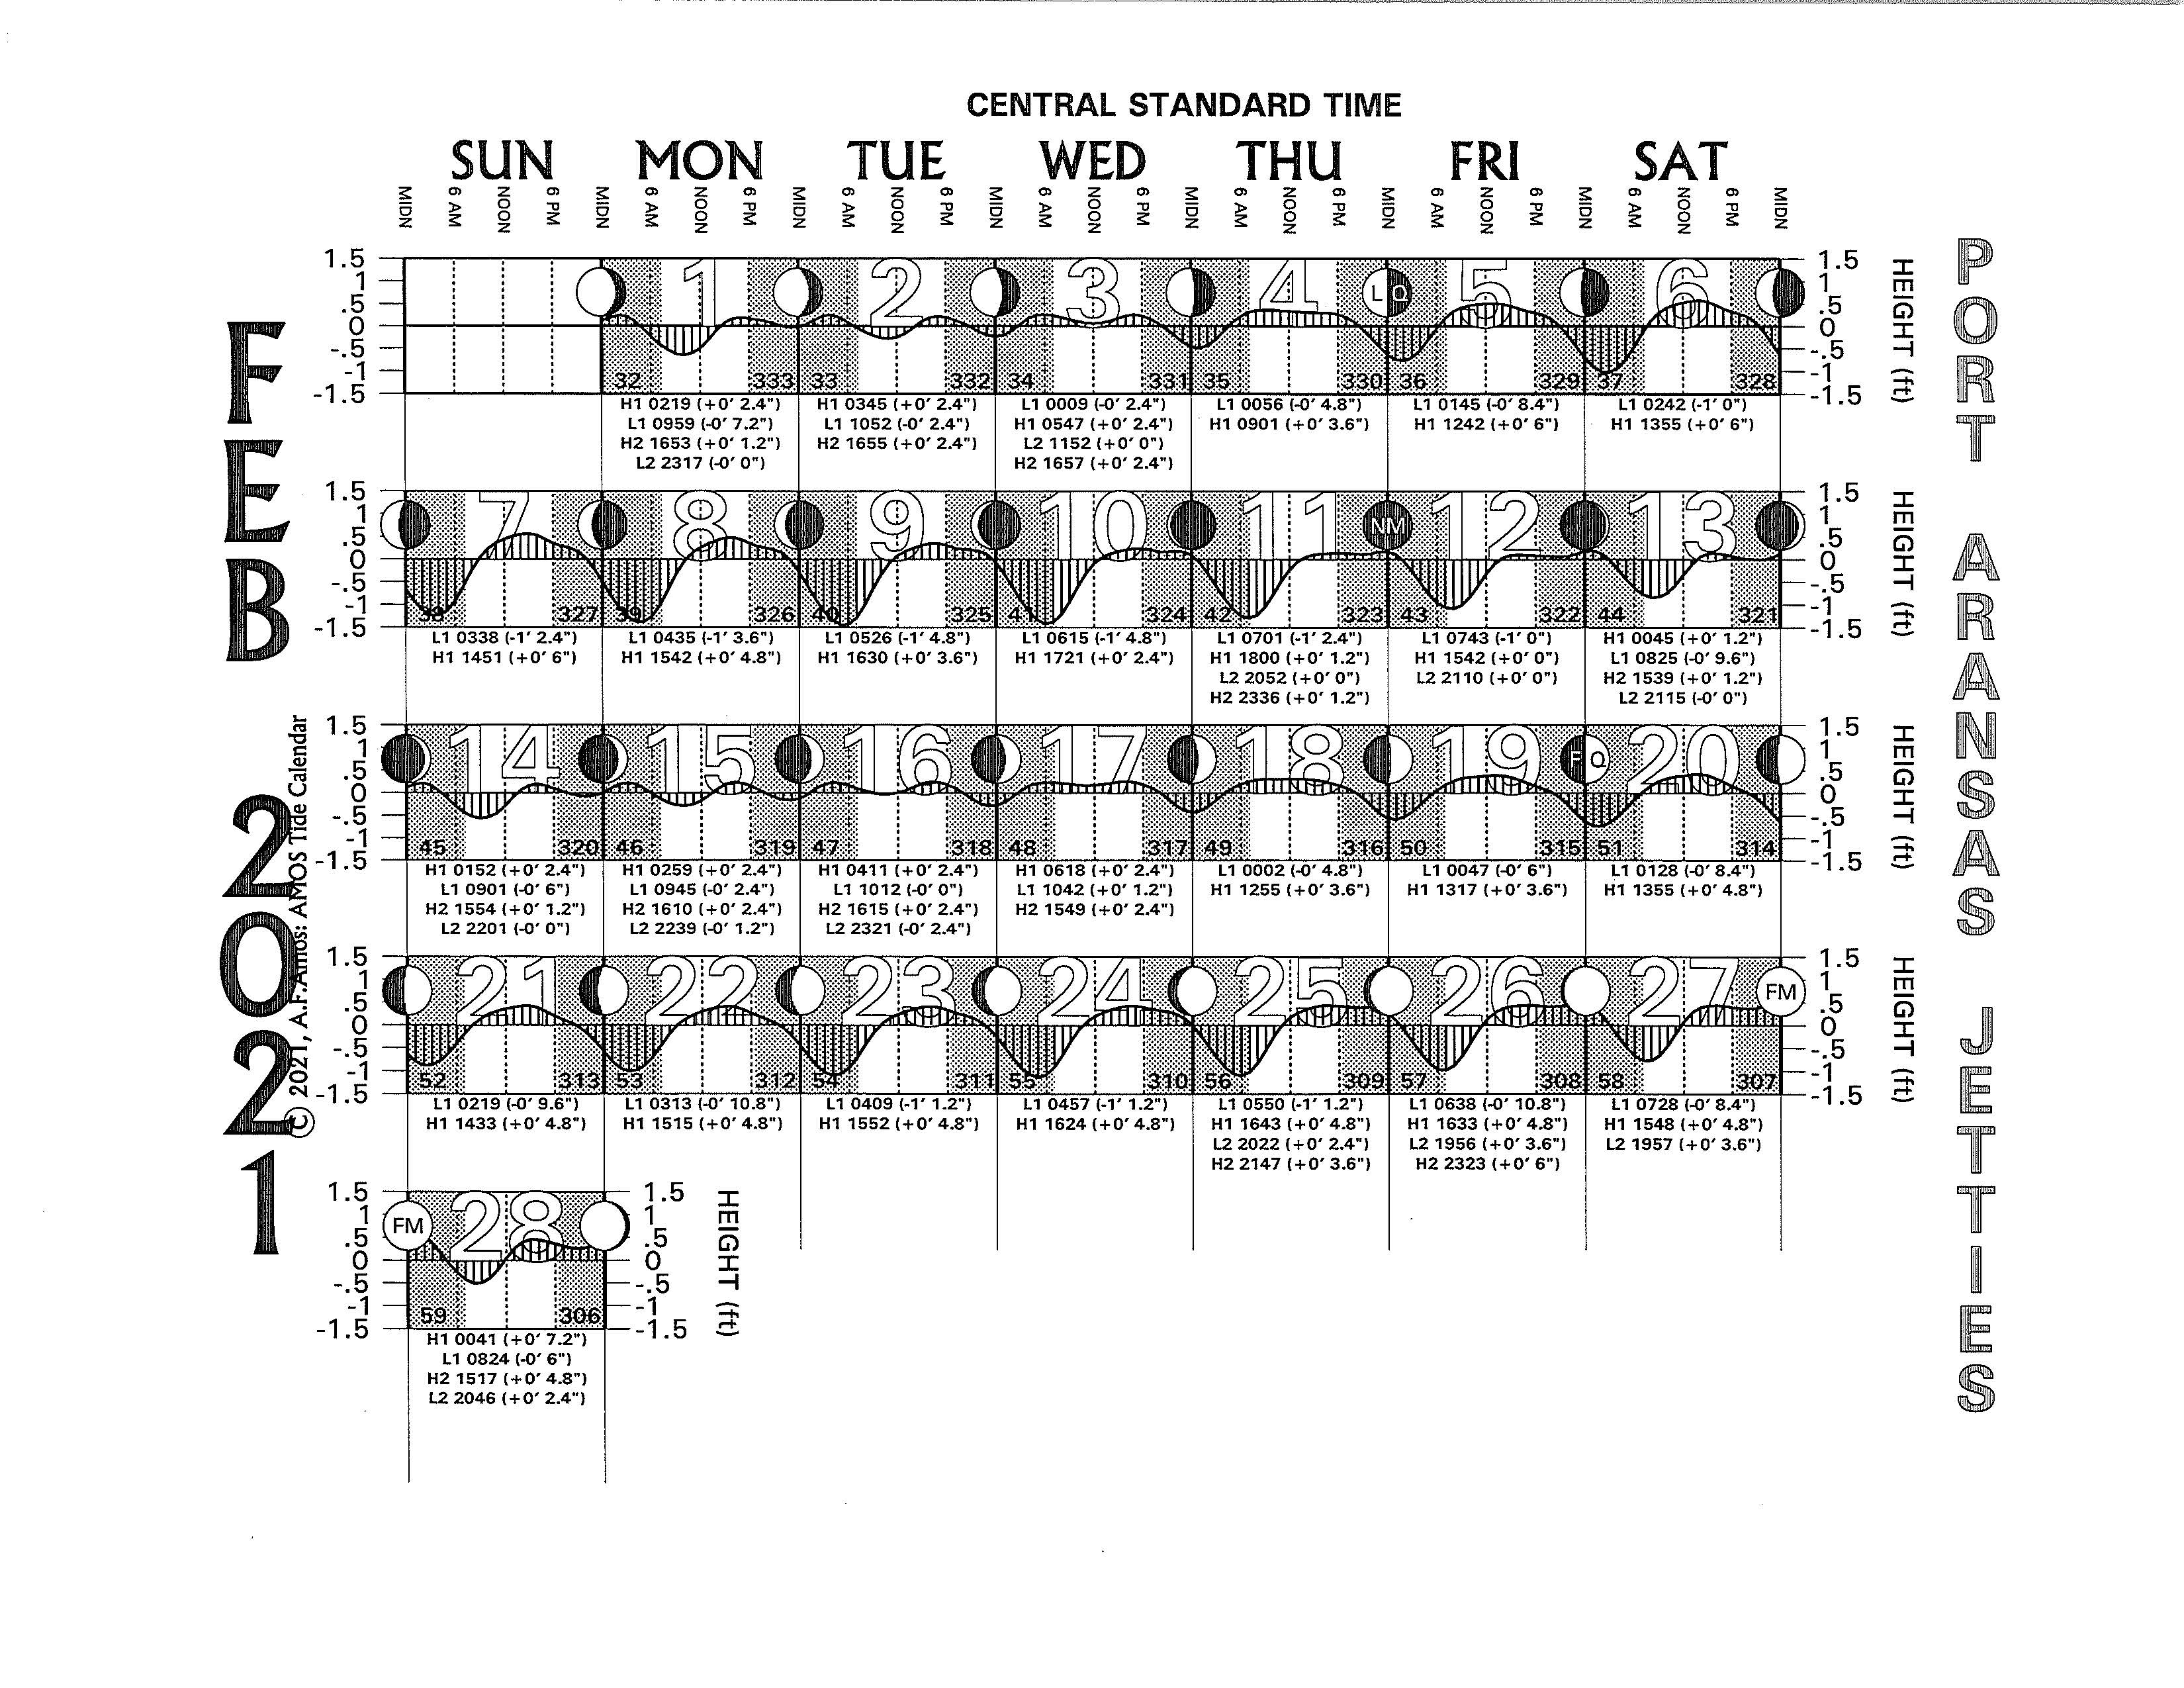
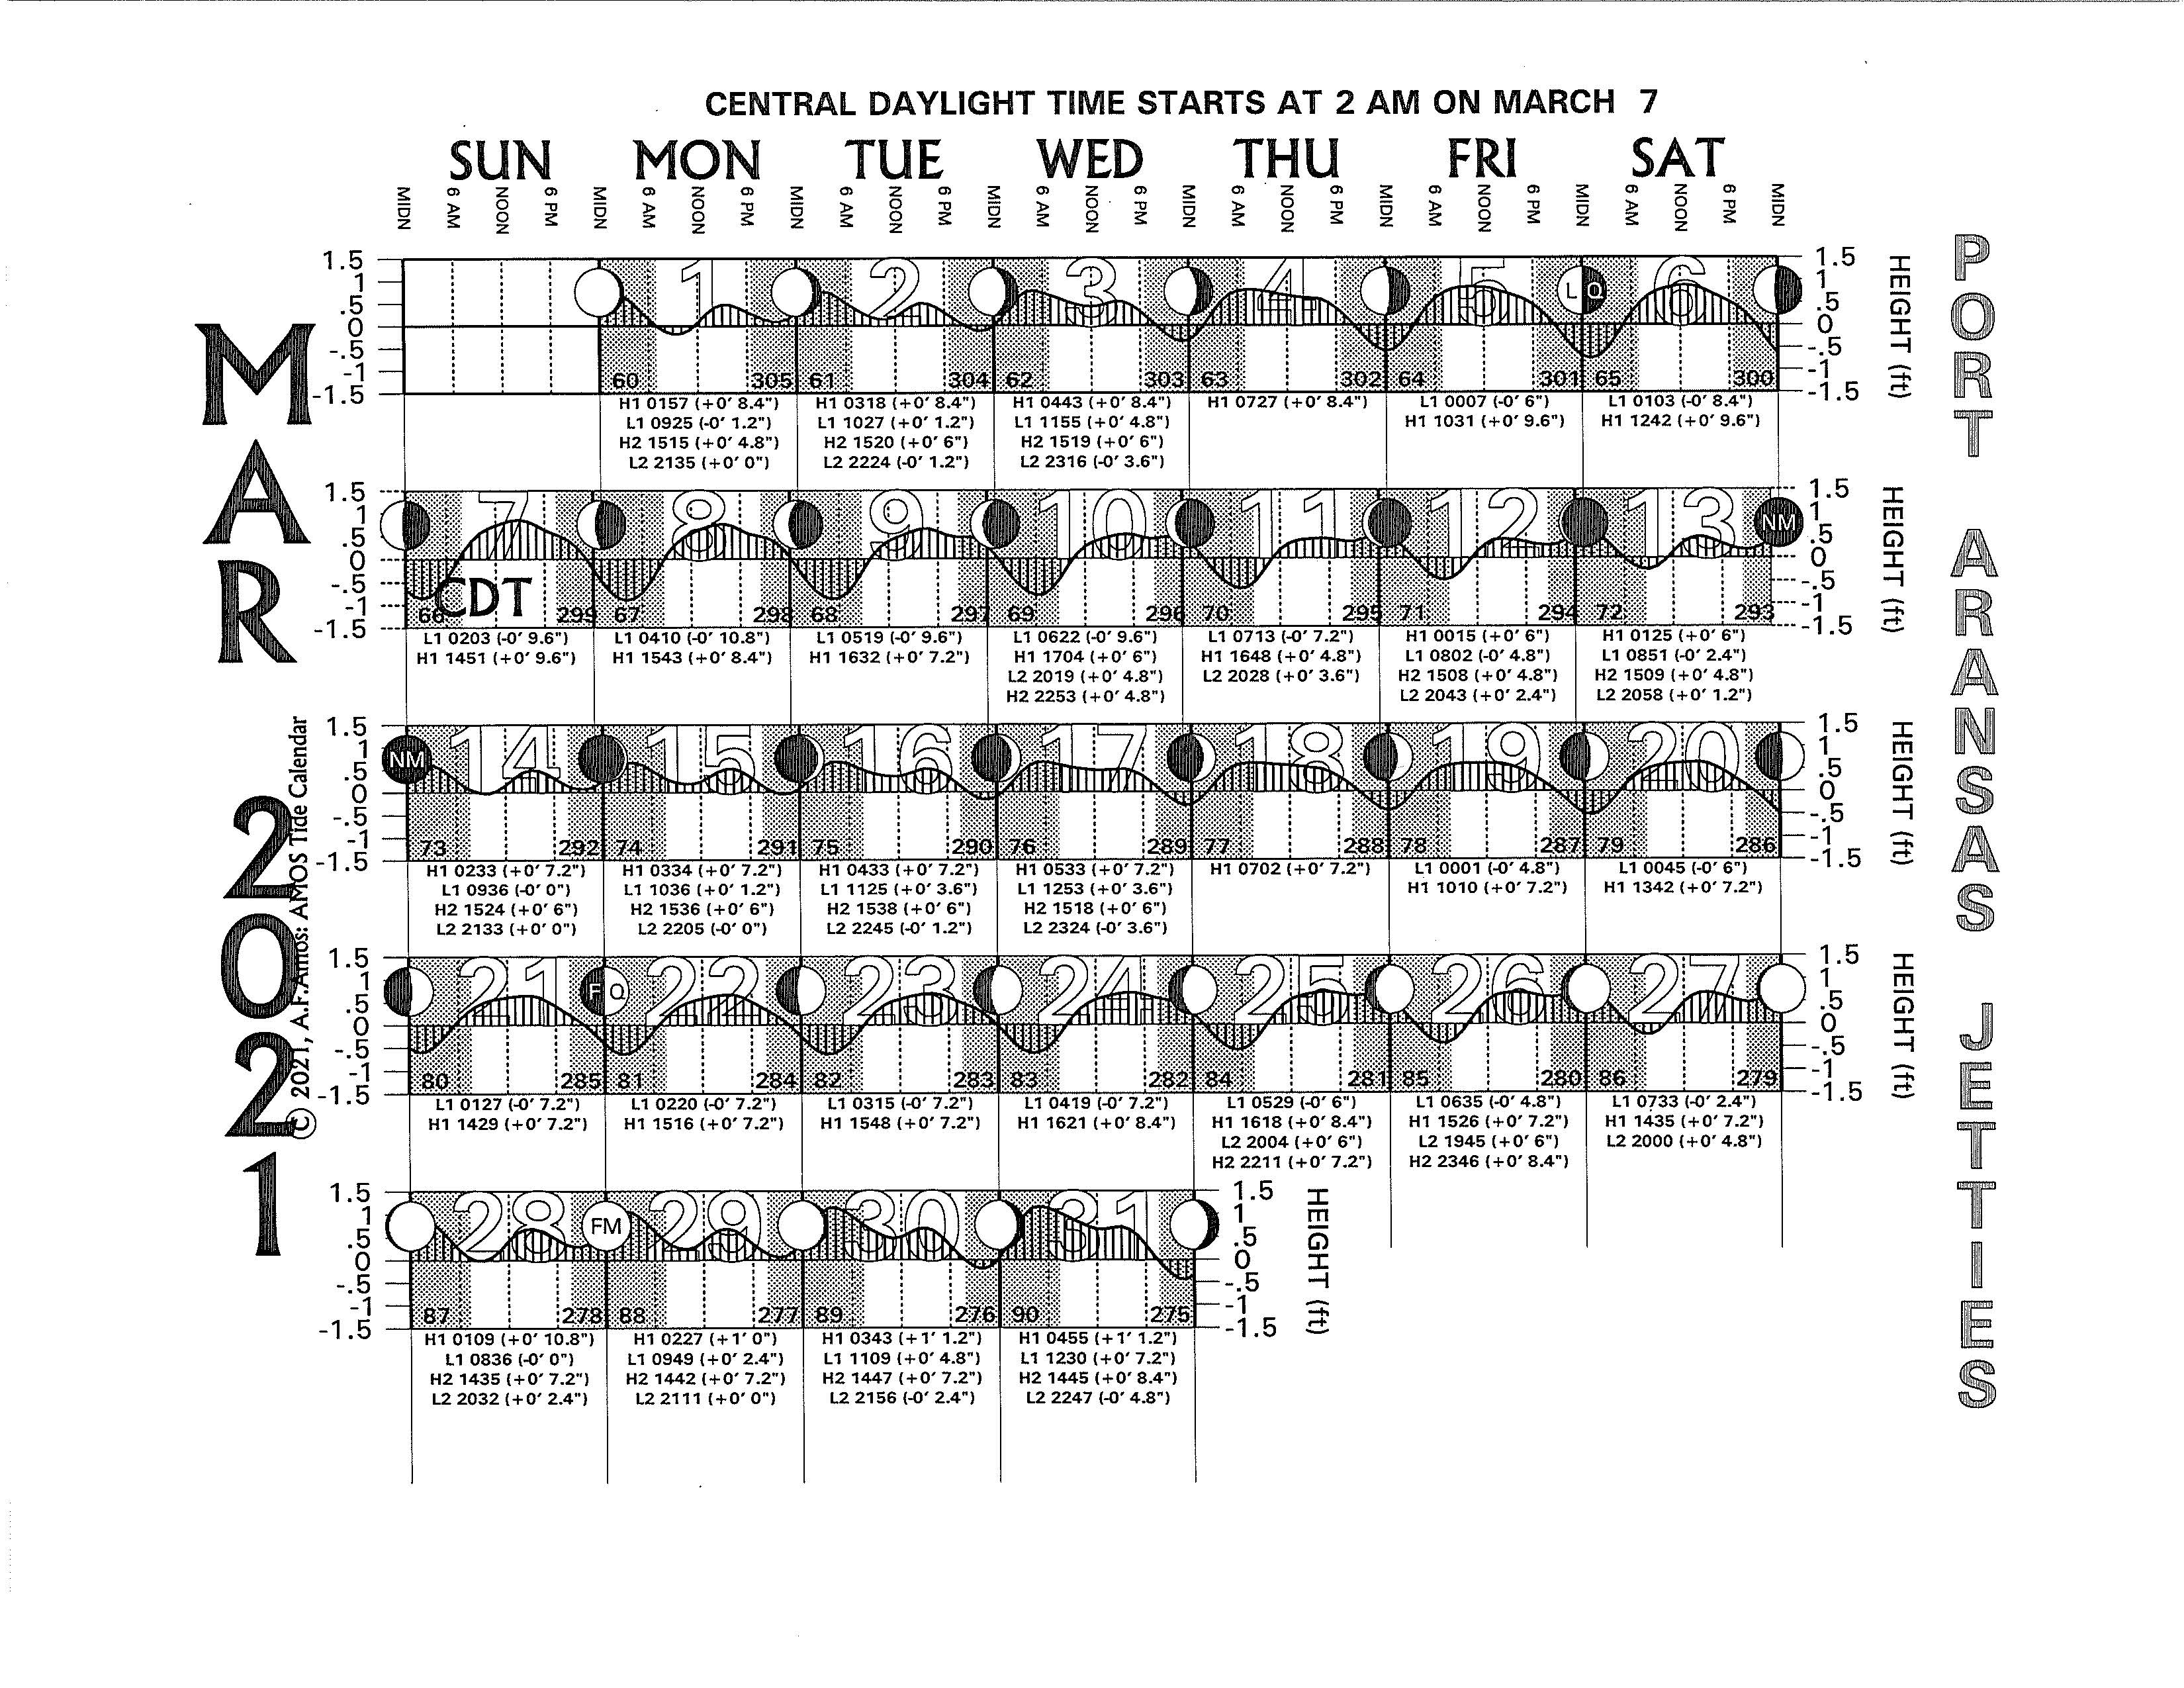
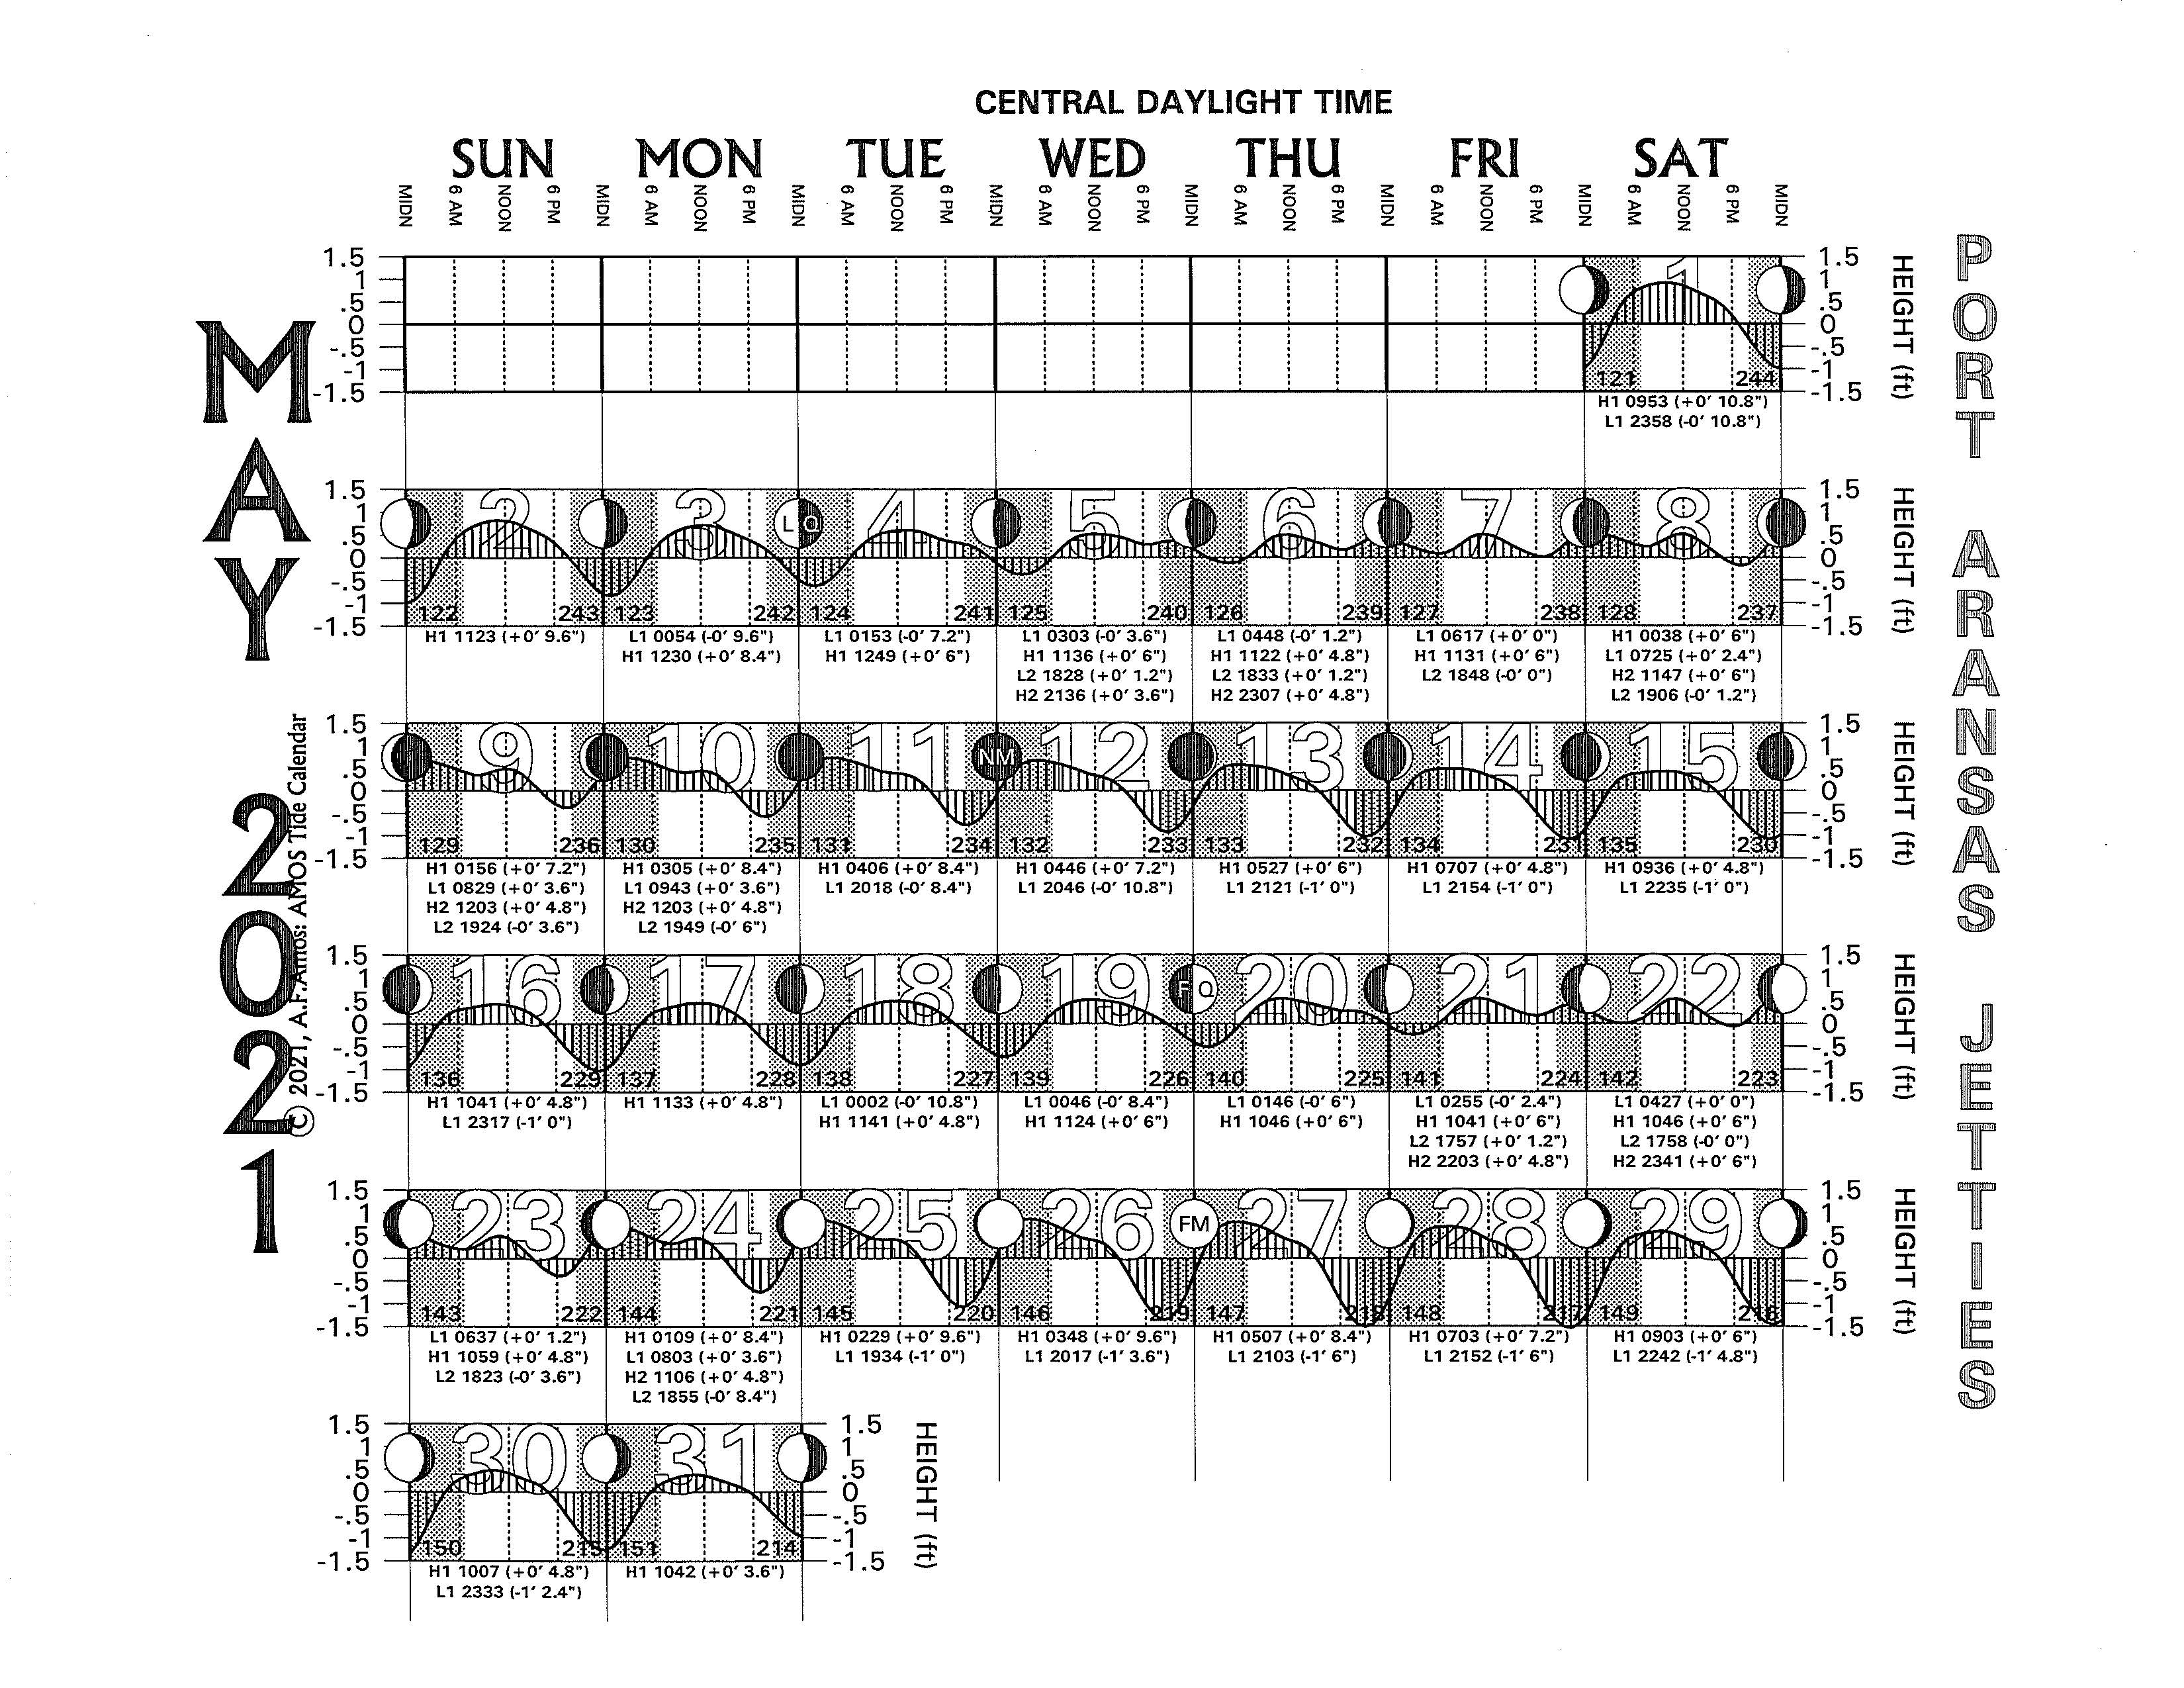
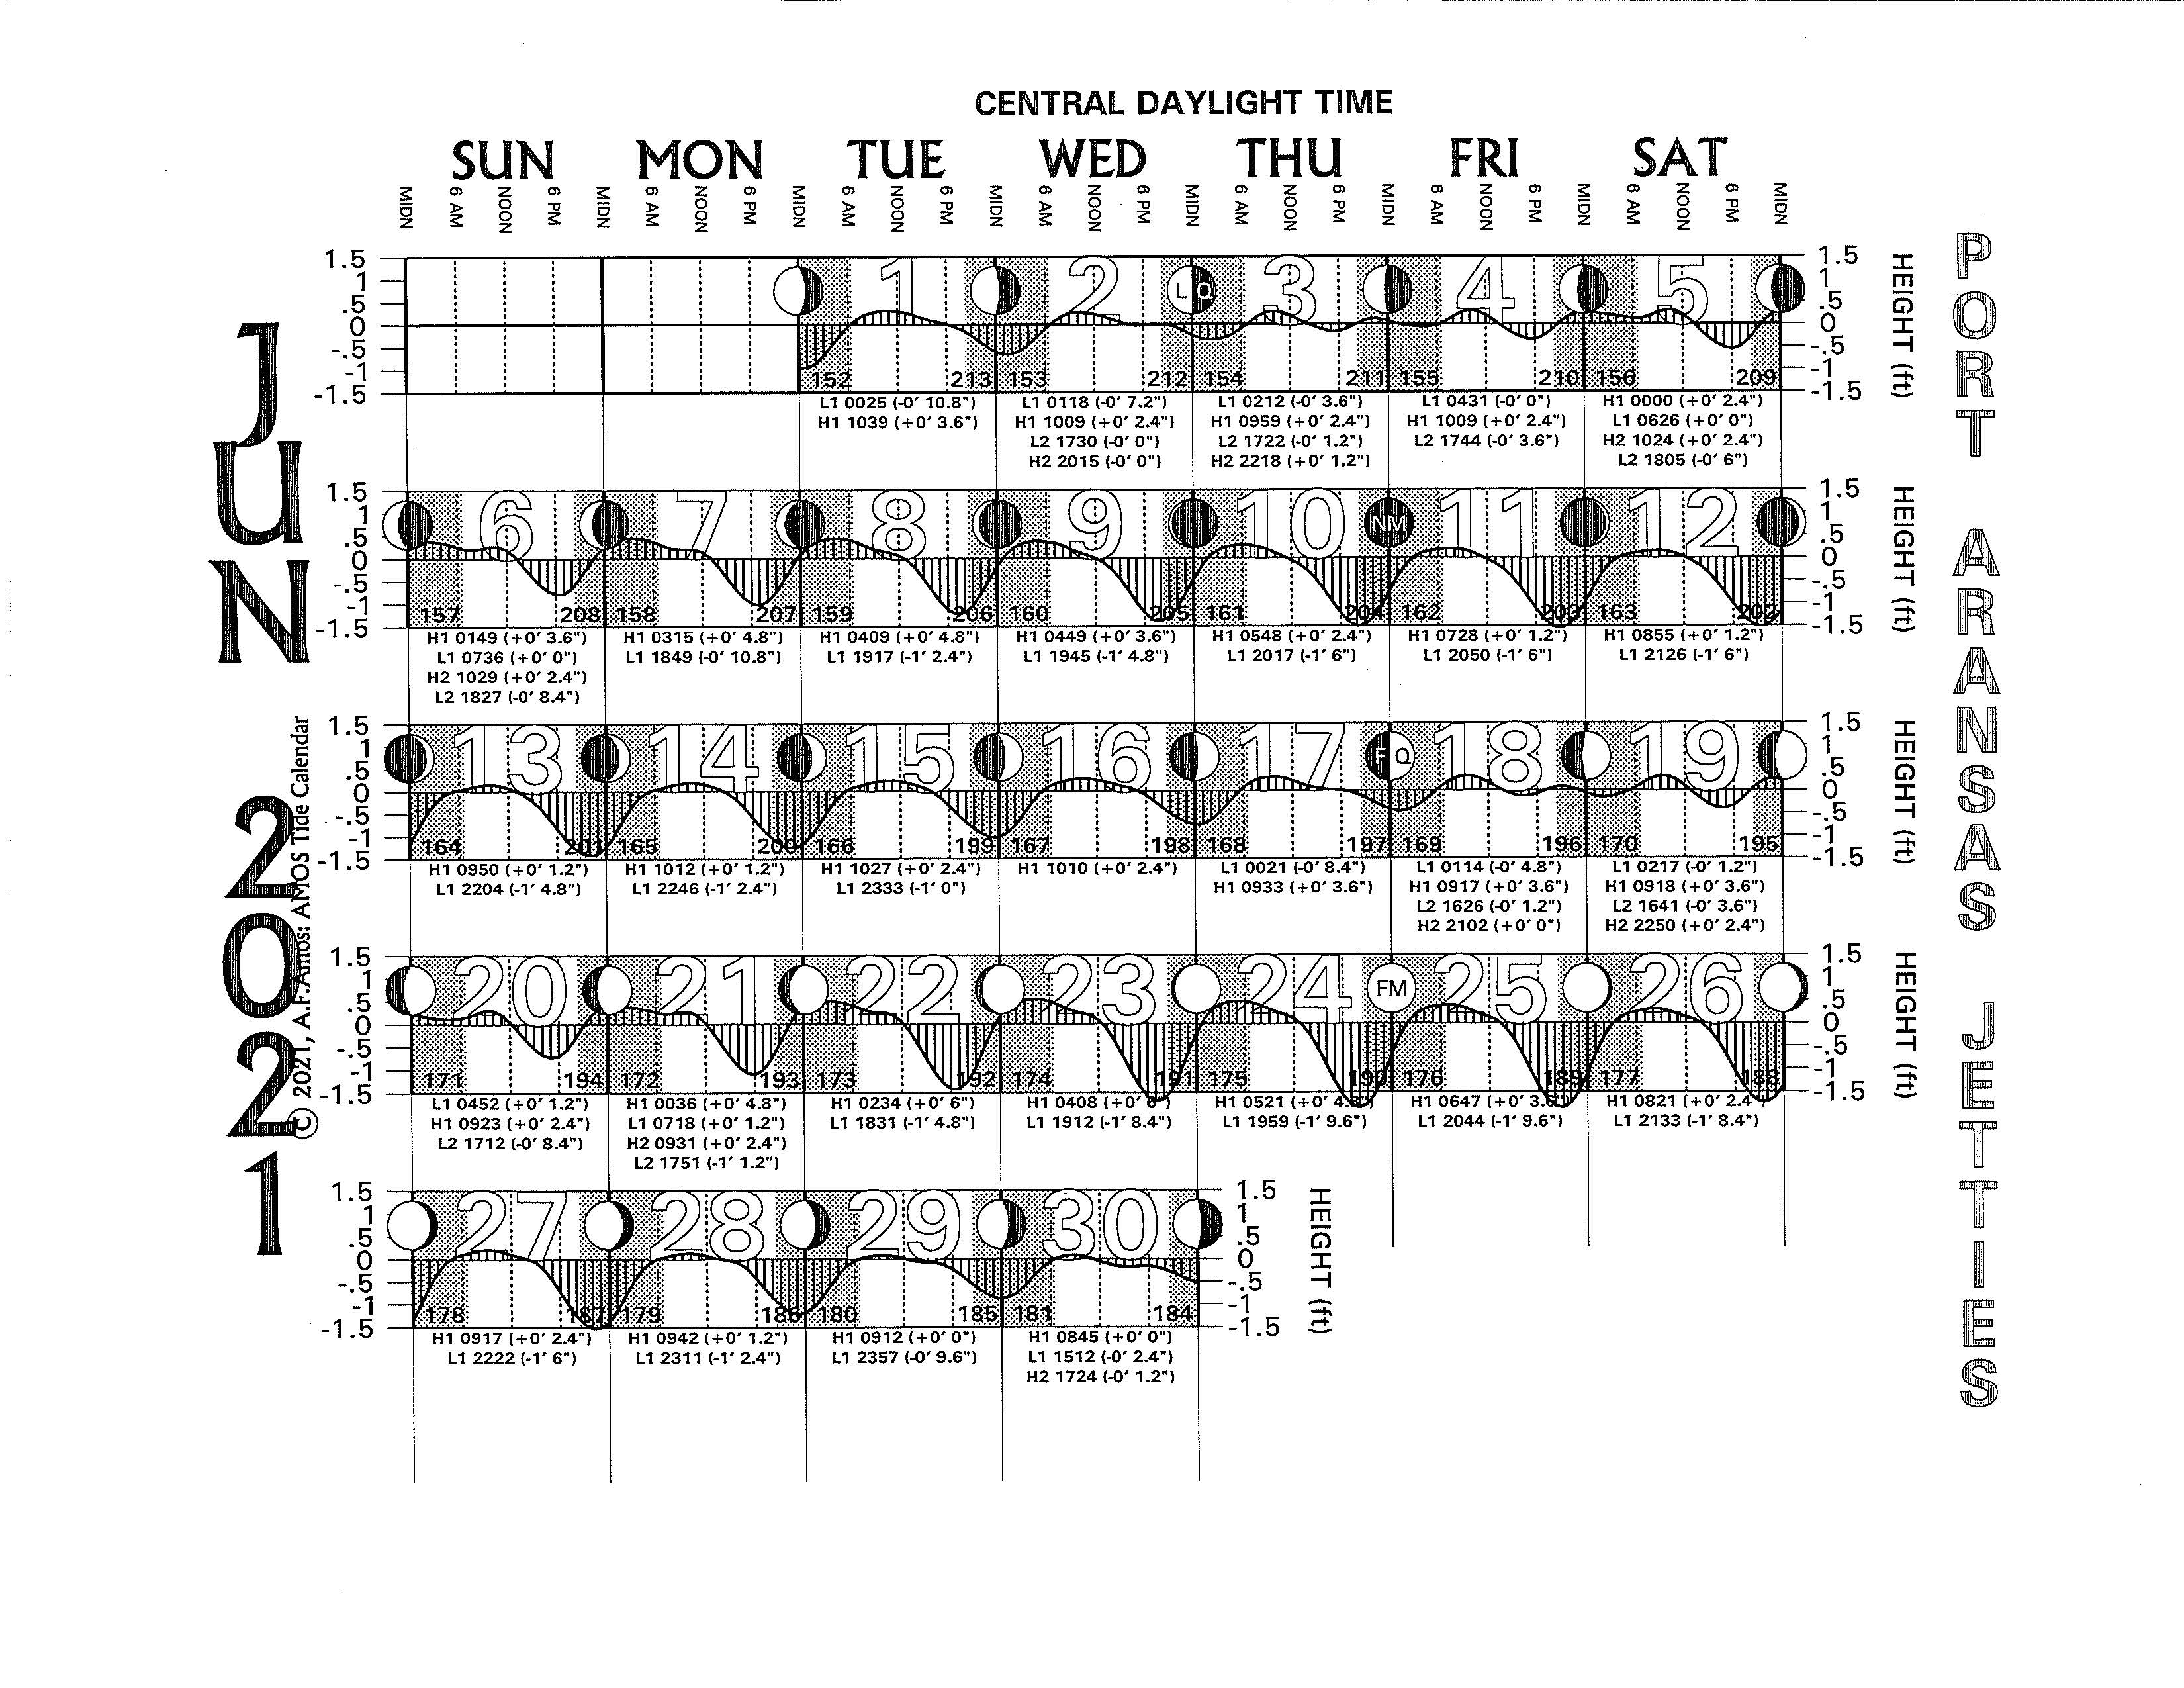
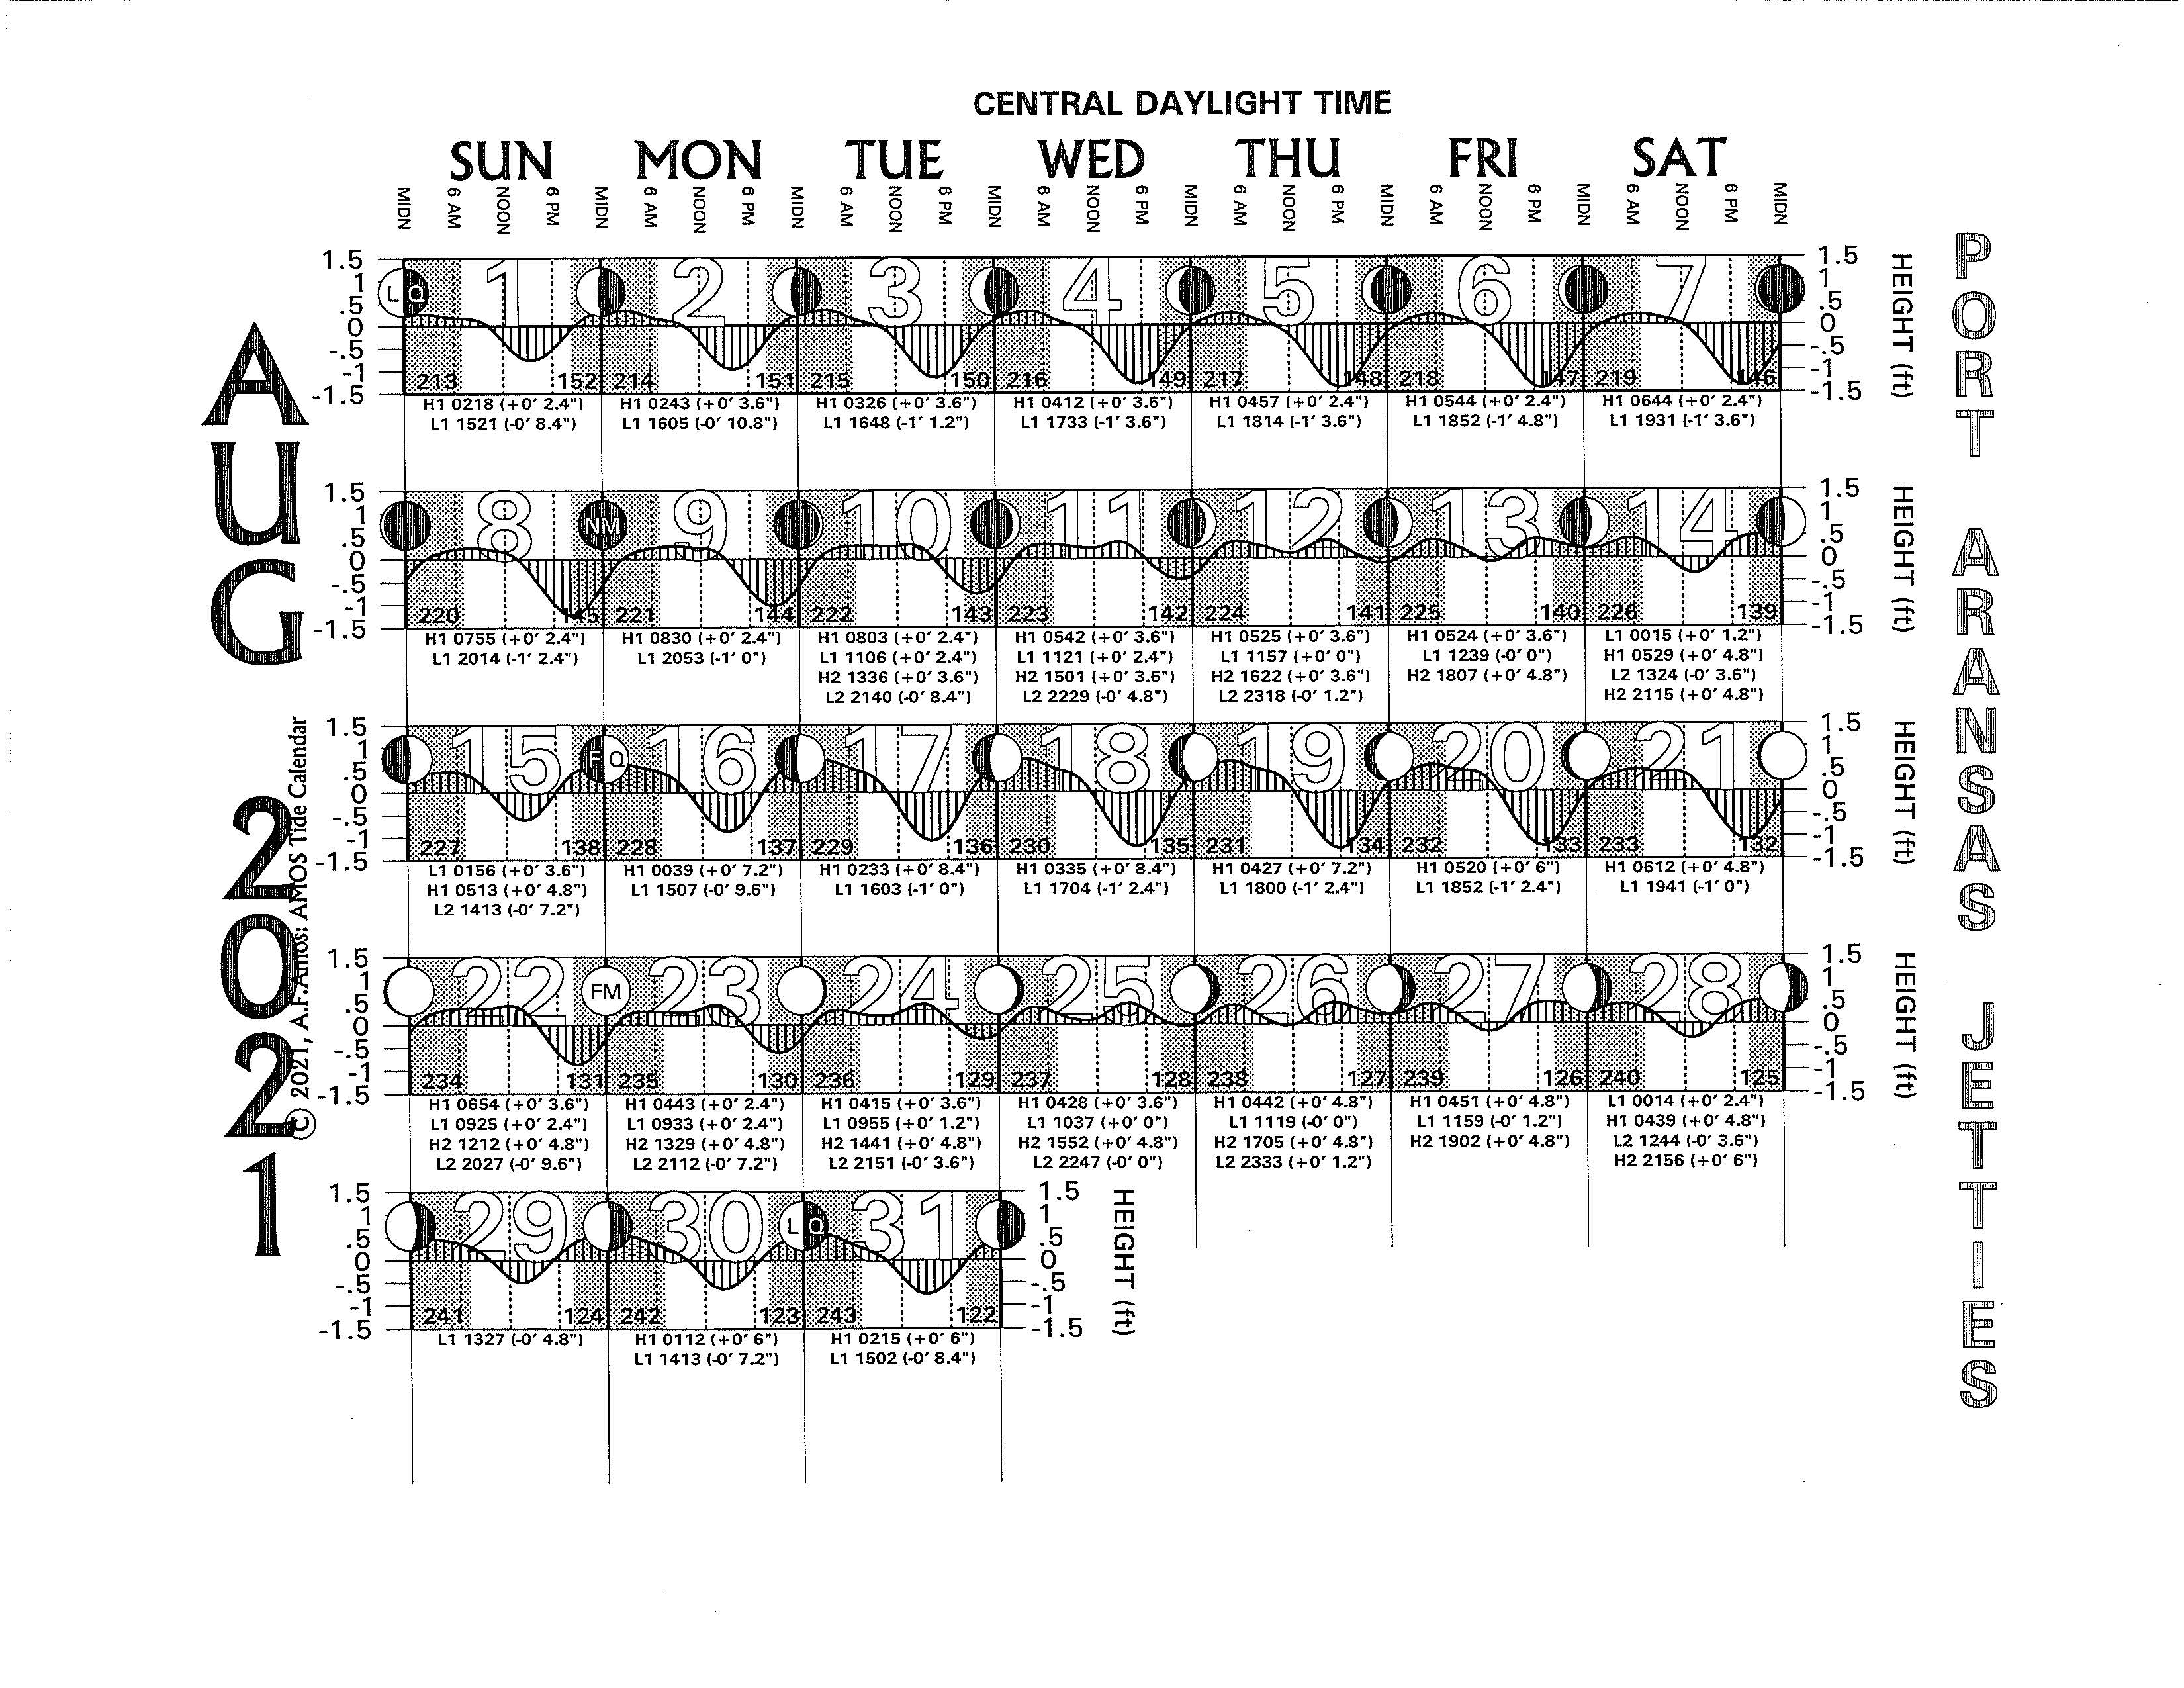
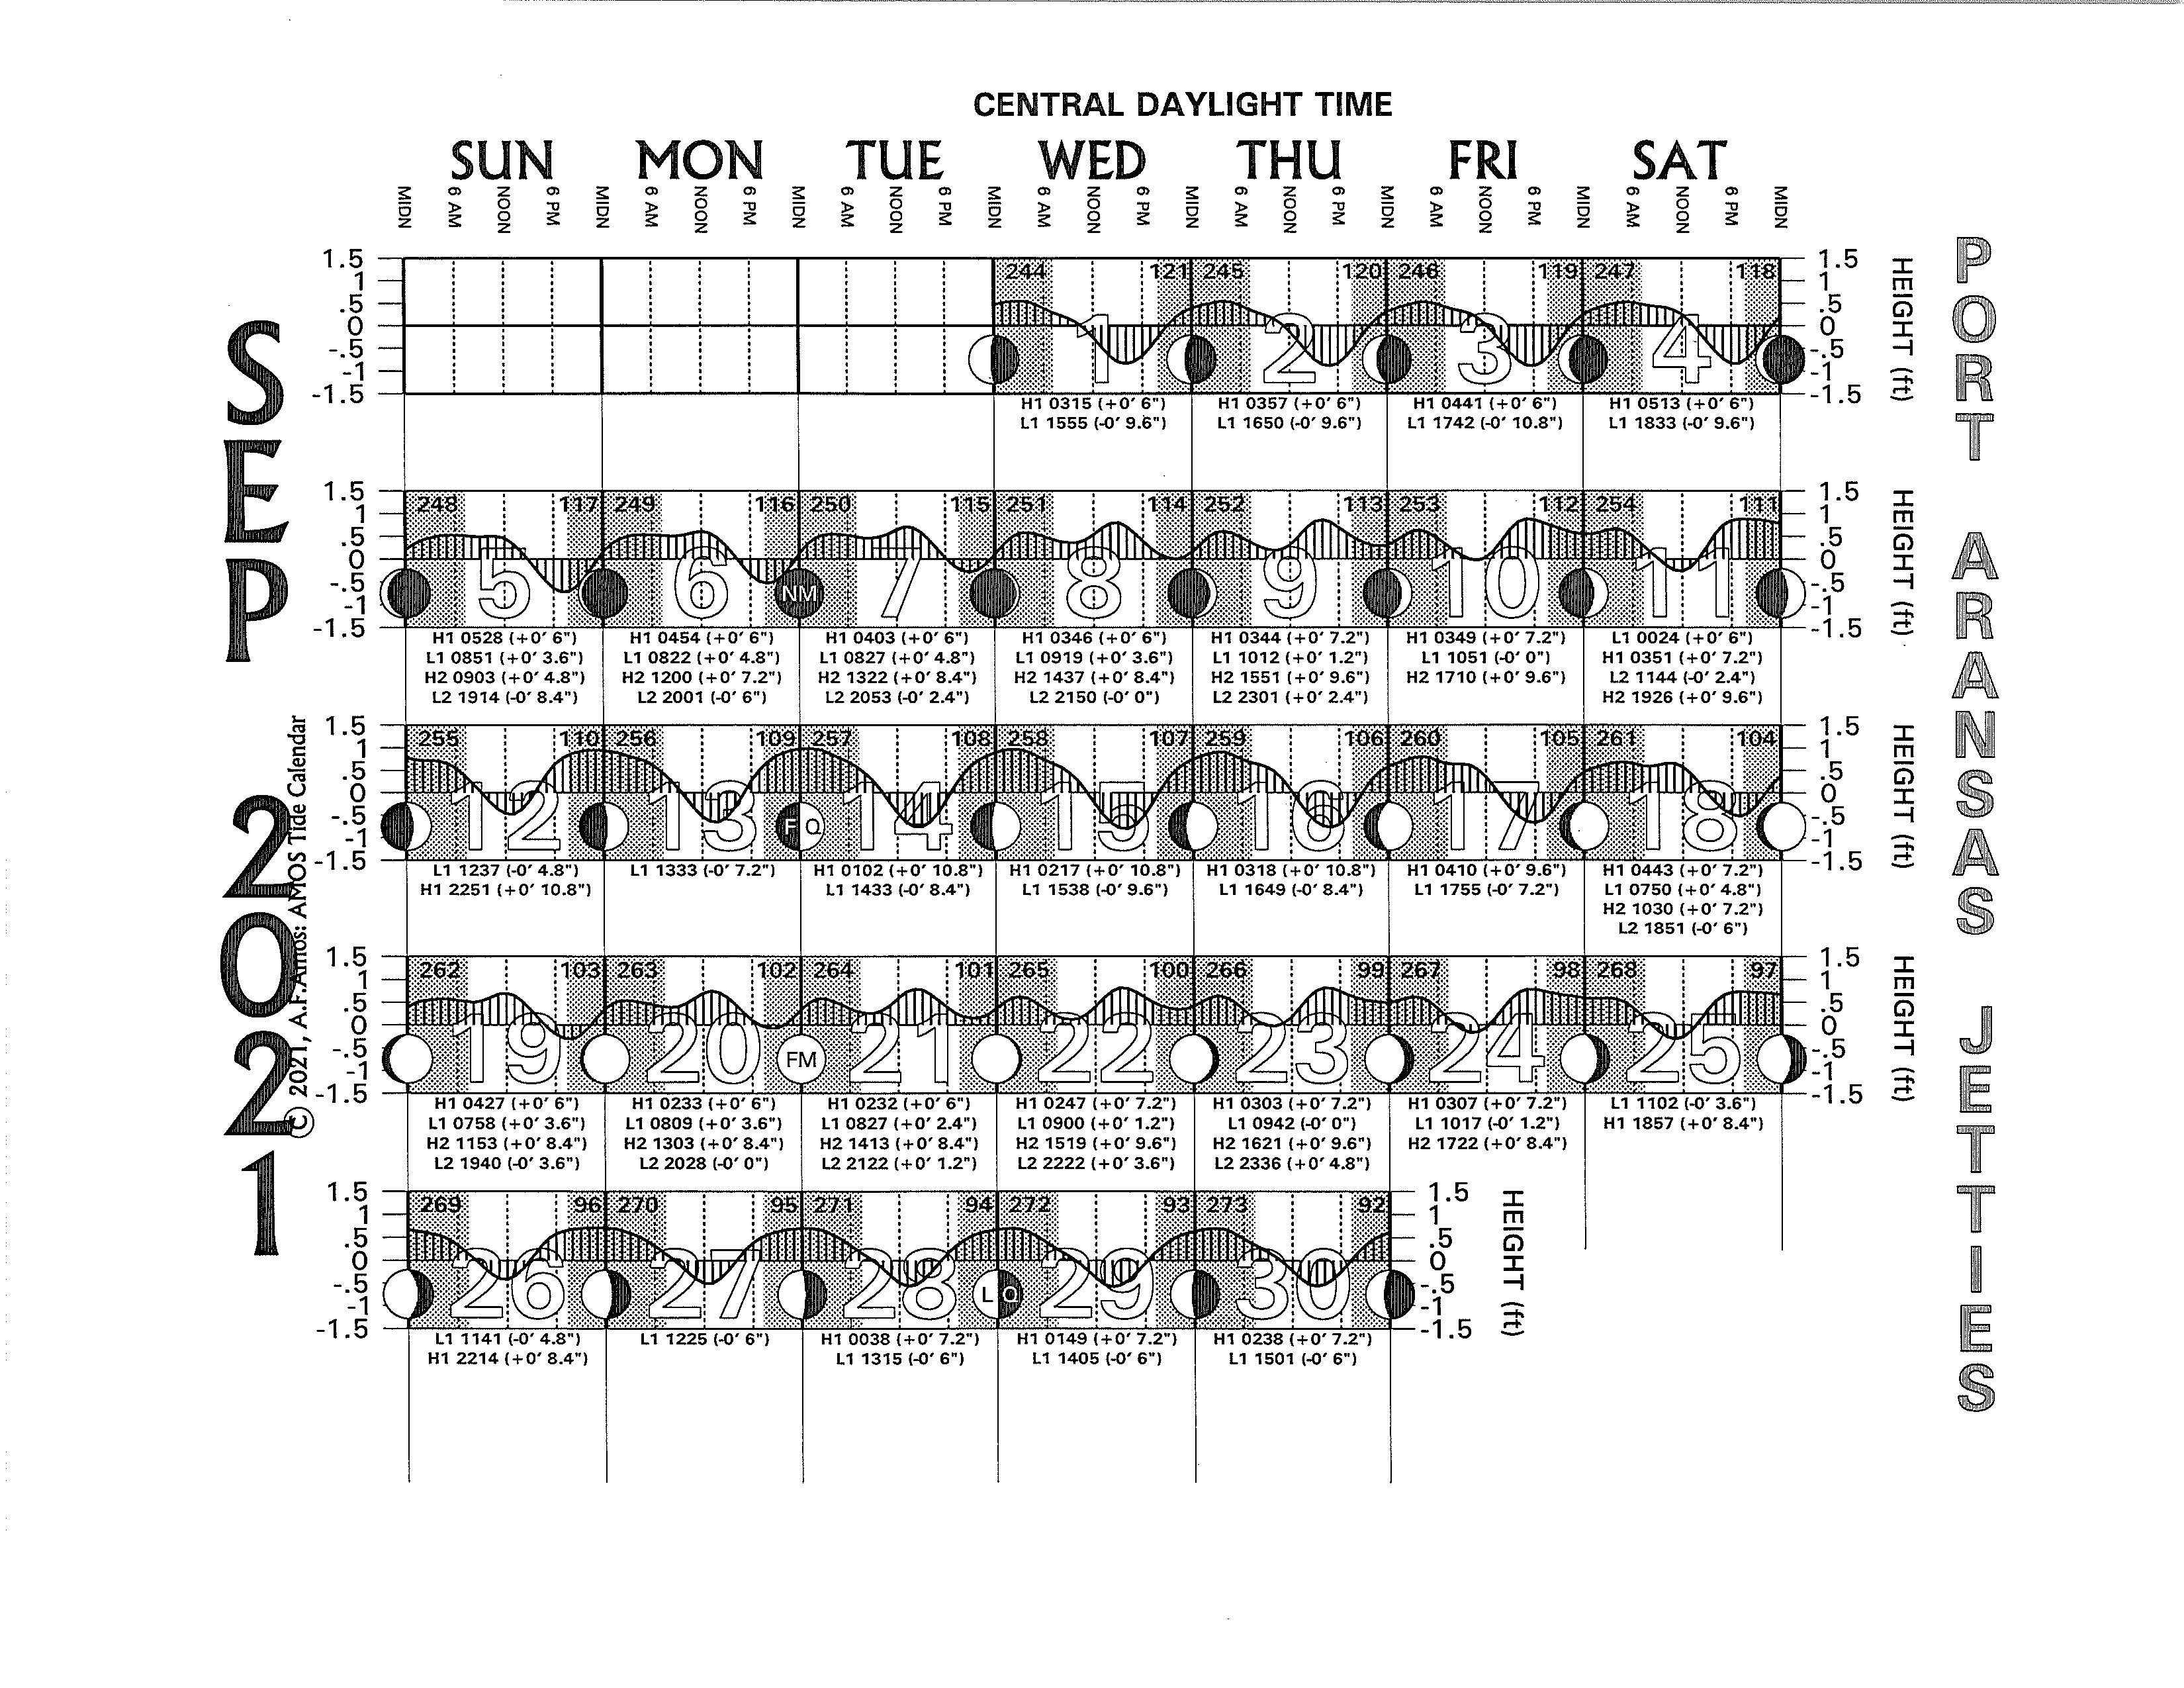
2021 Tide Charts - Texas Tides: Port Aransas Jetties
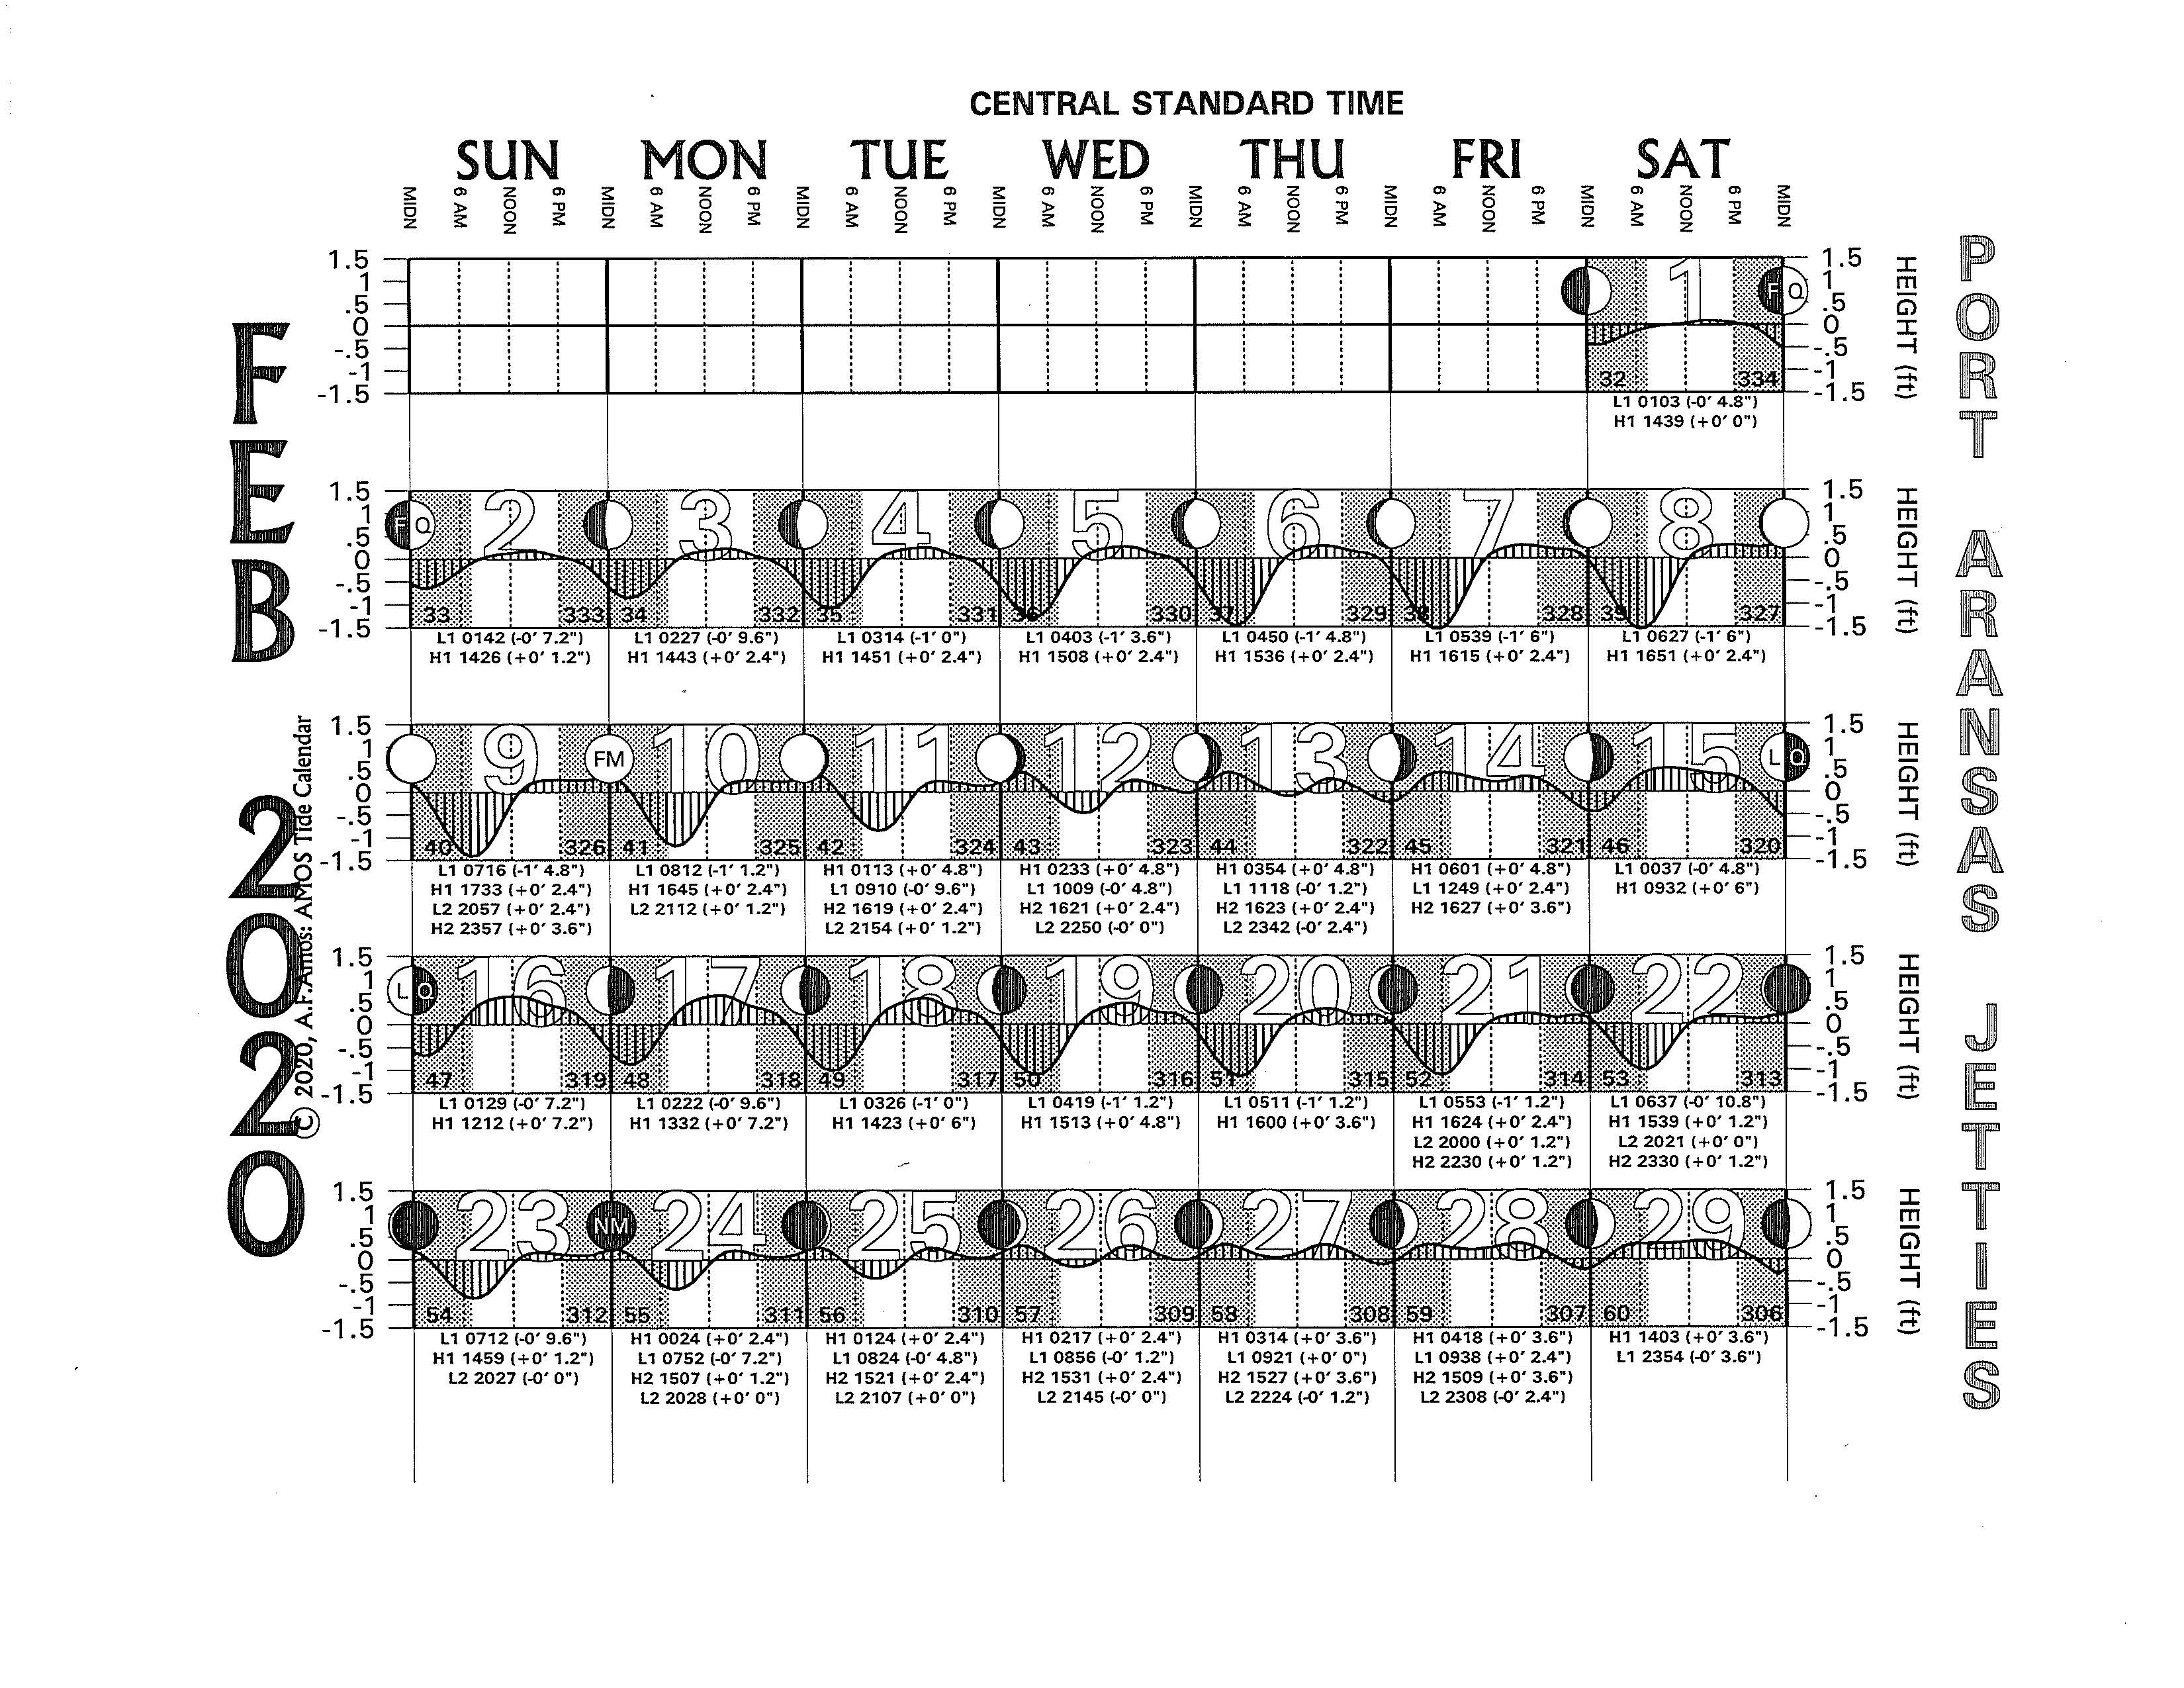
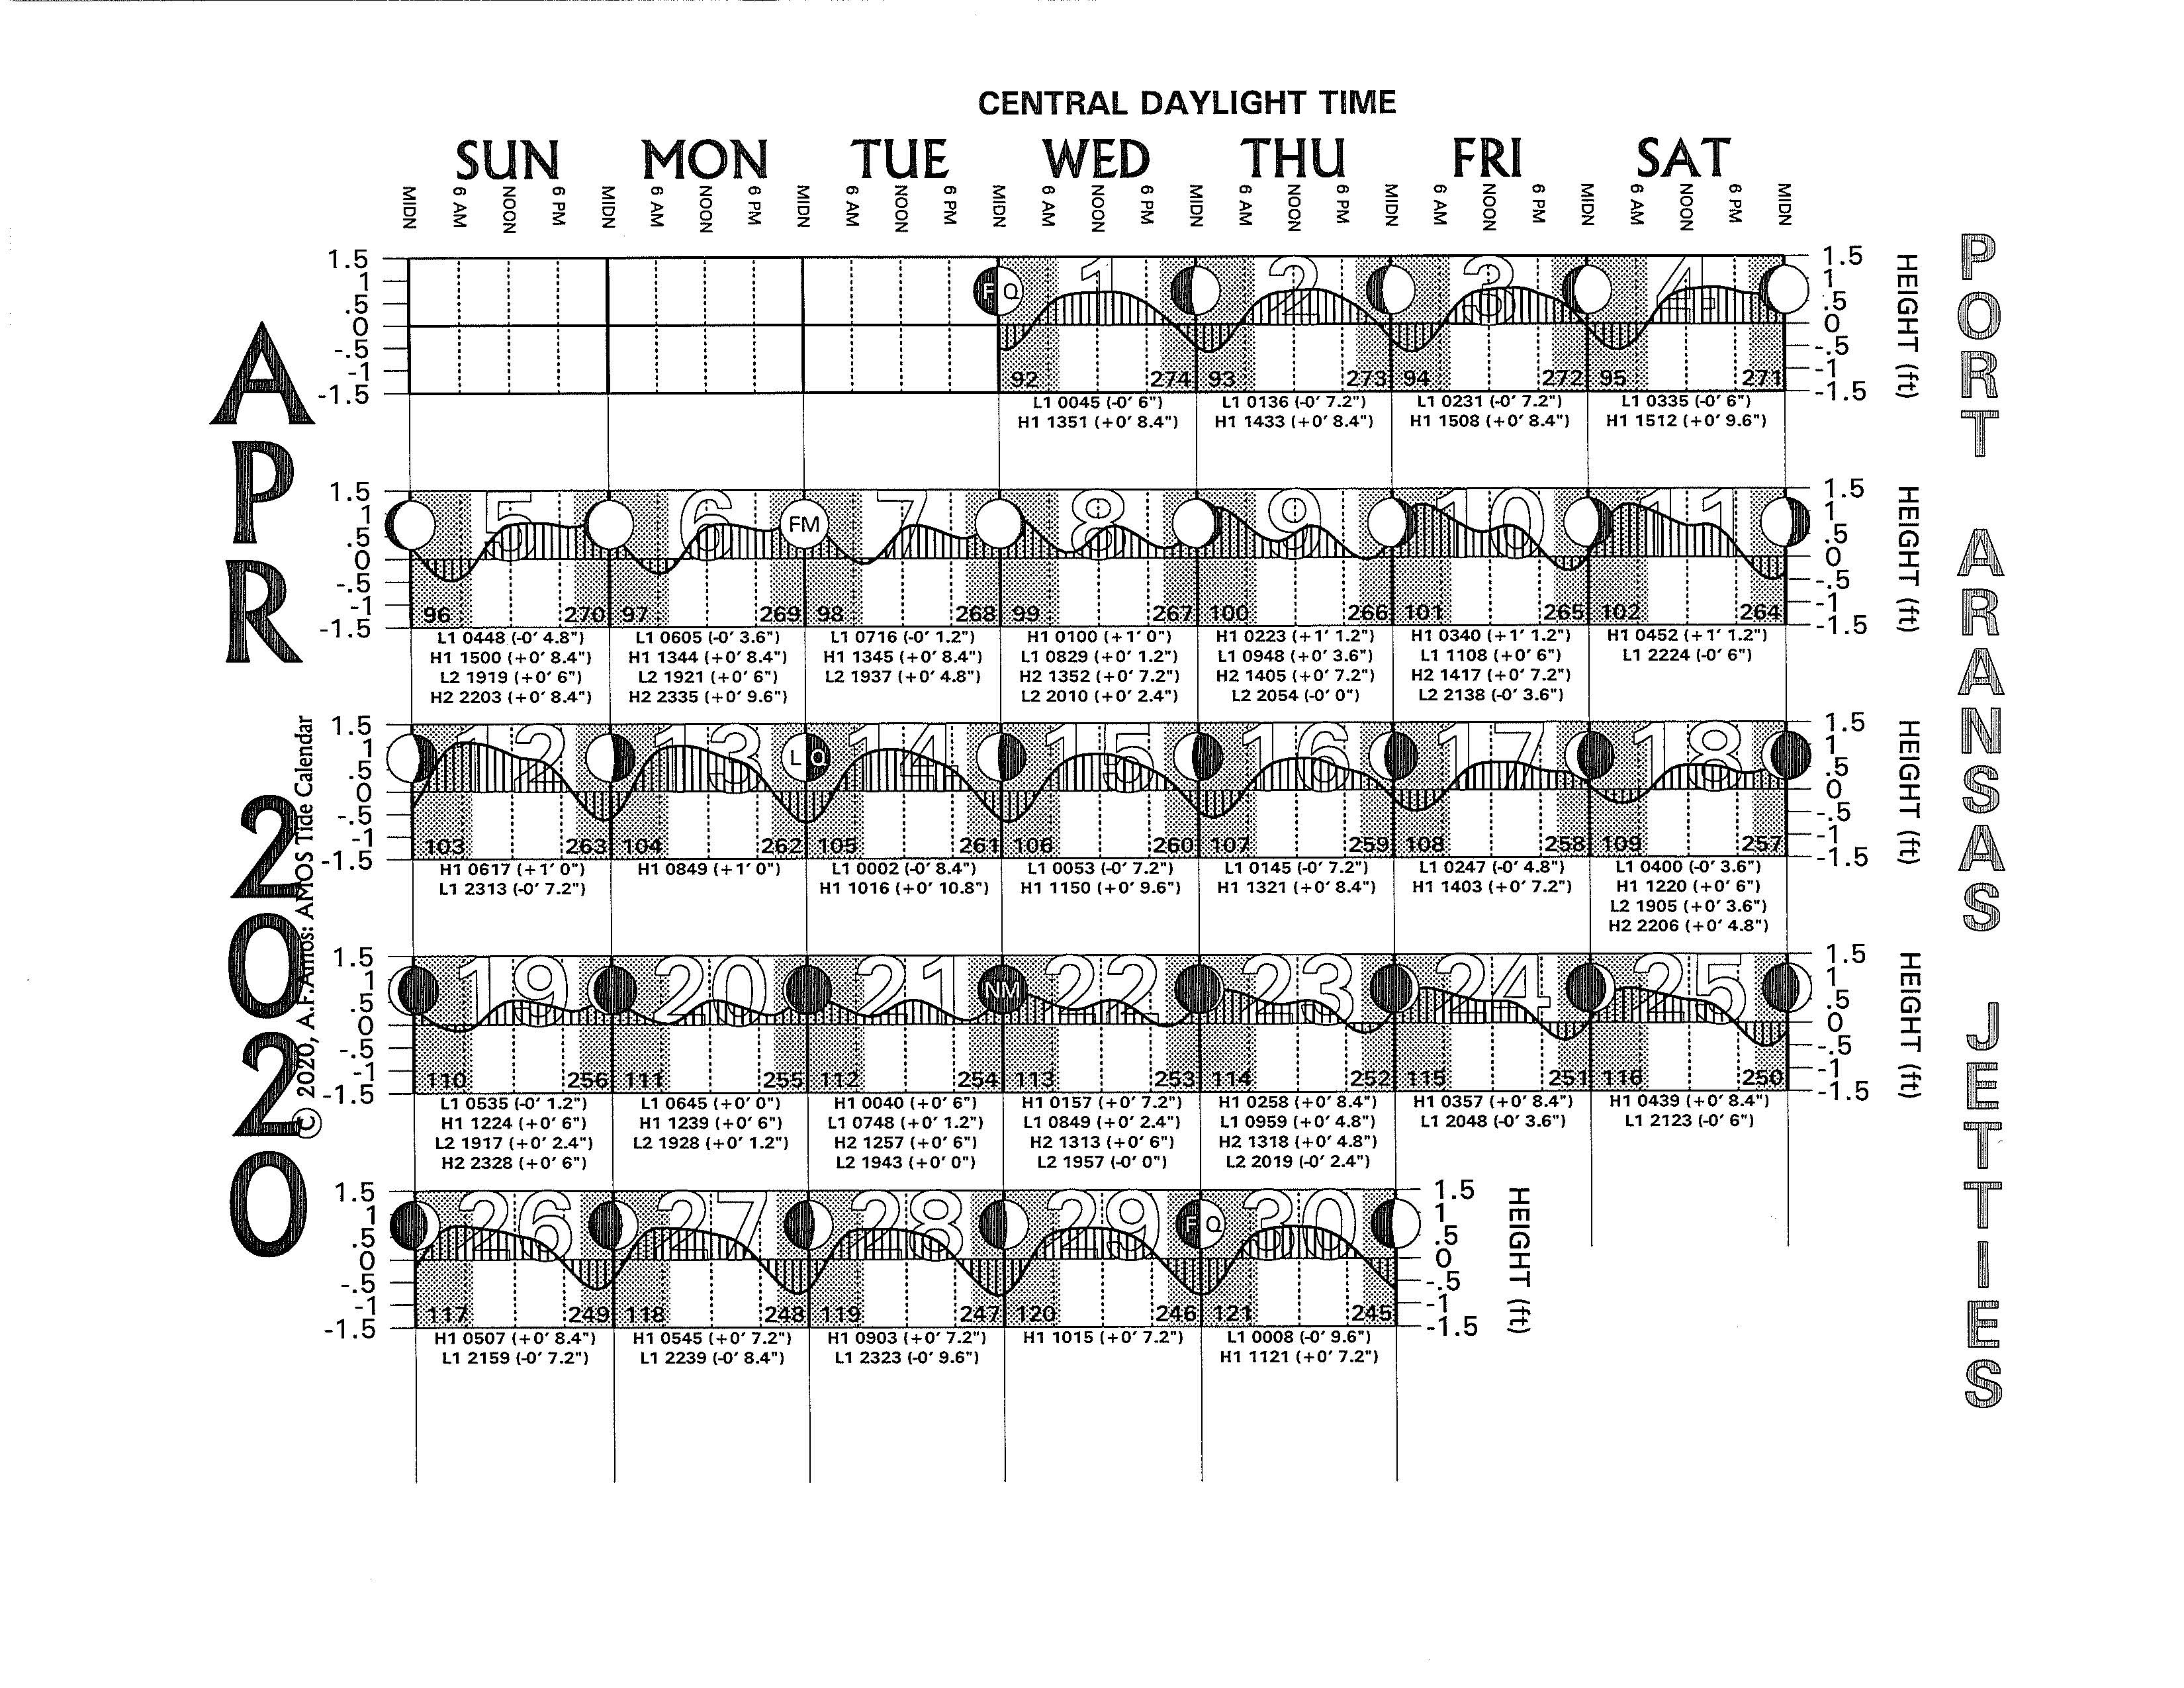
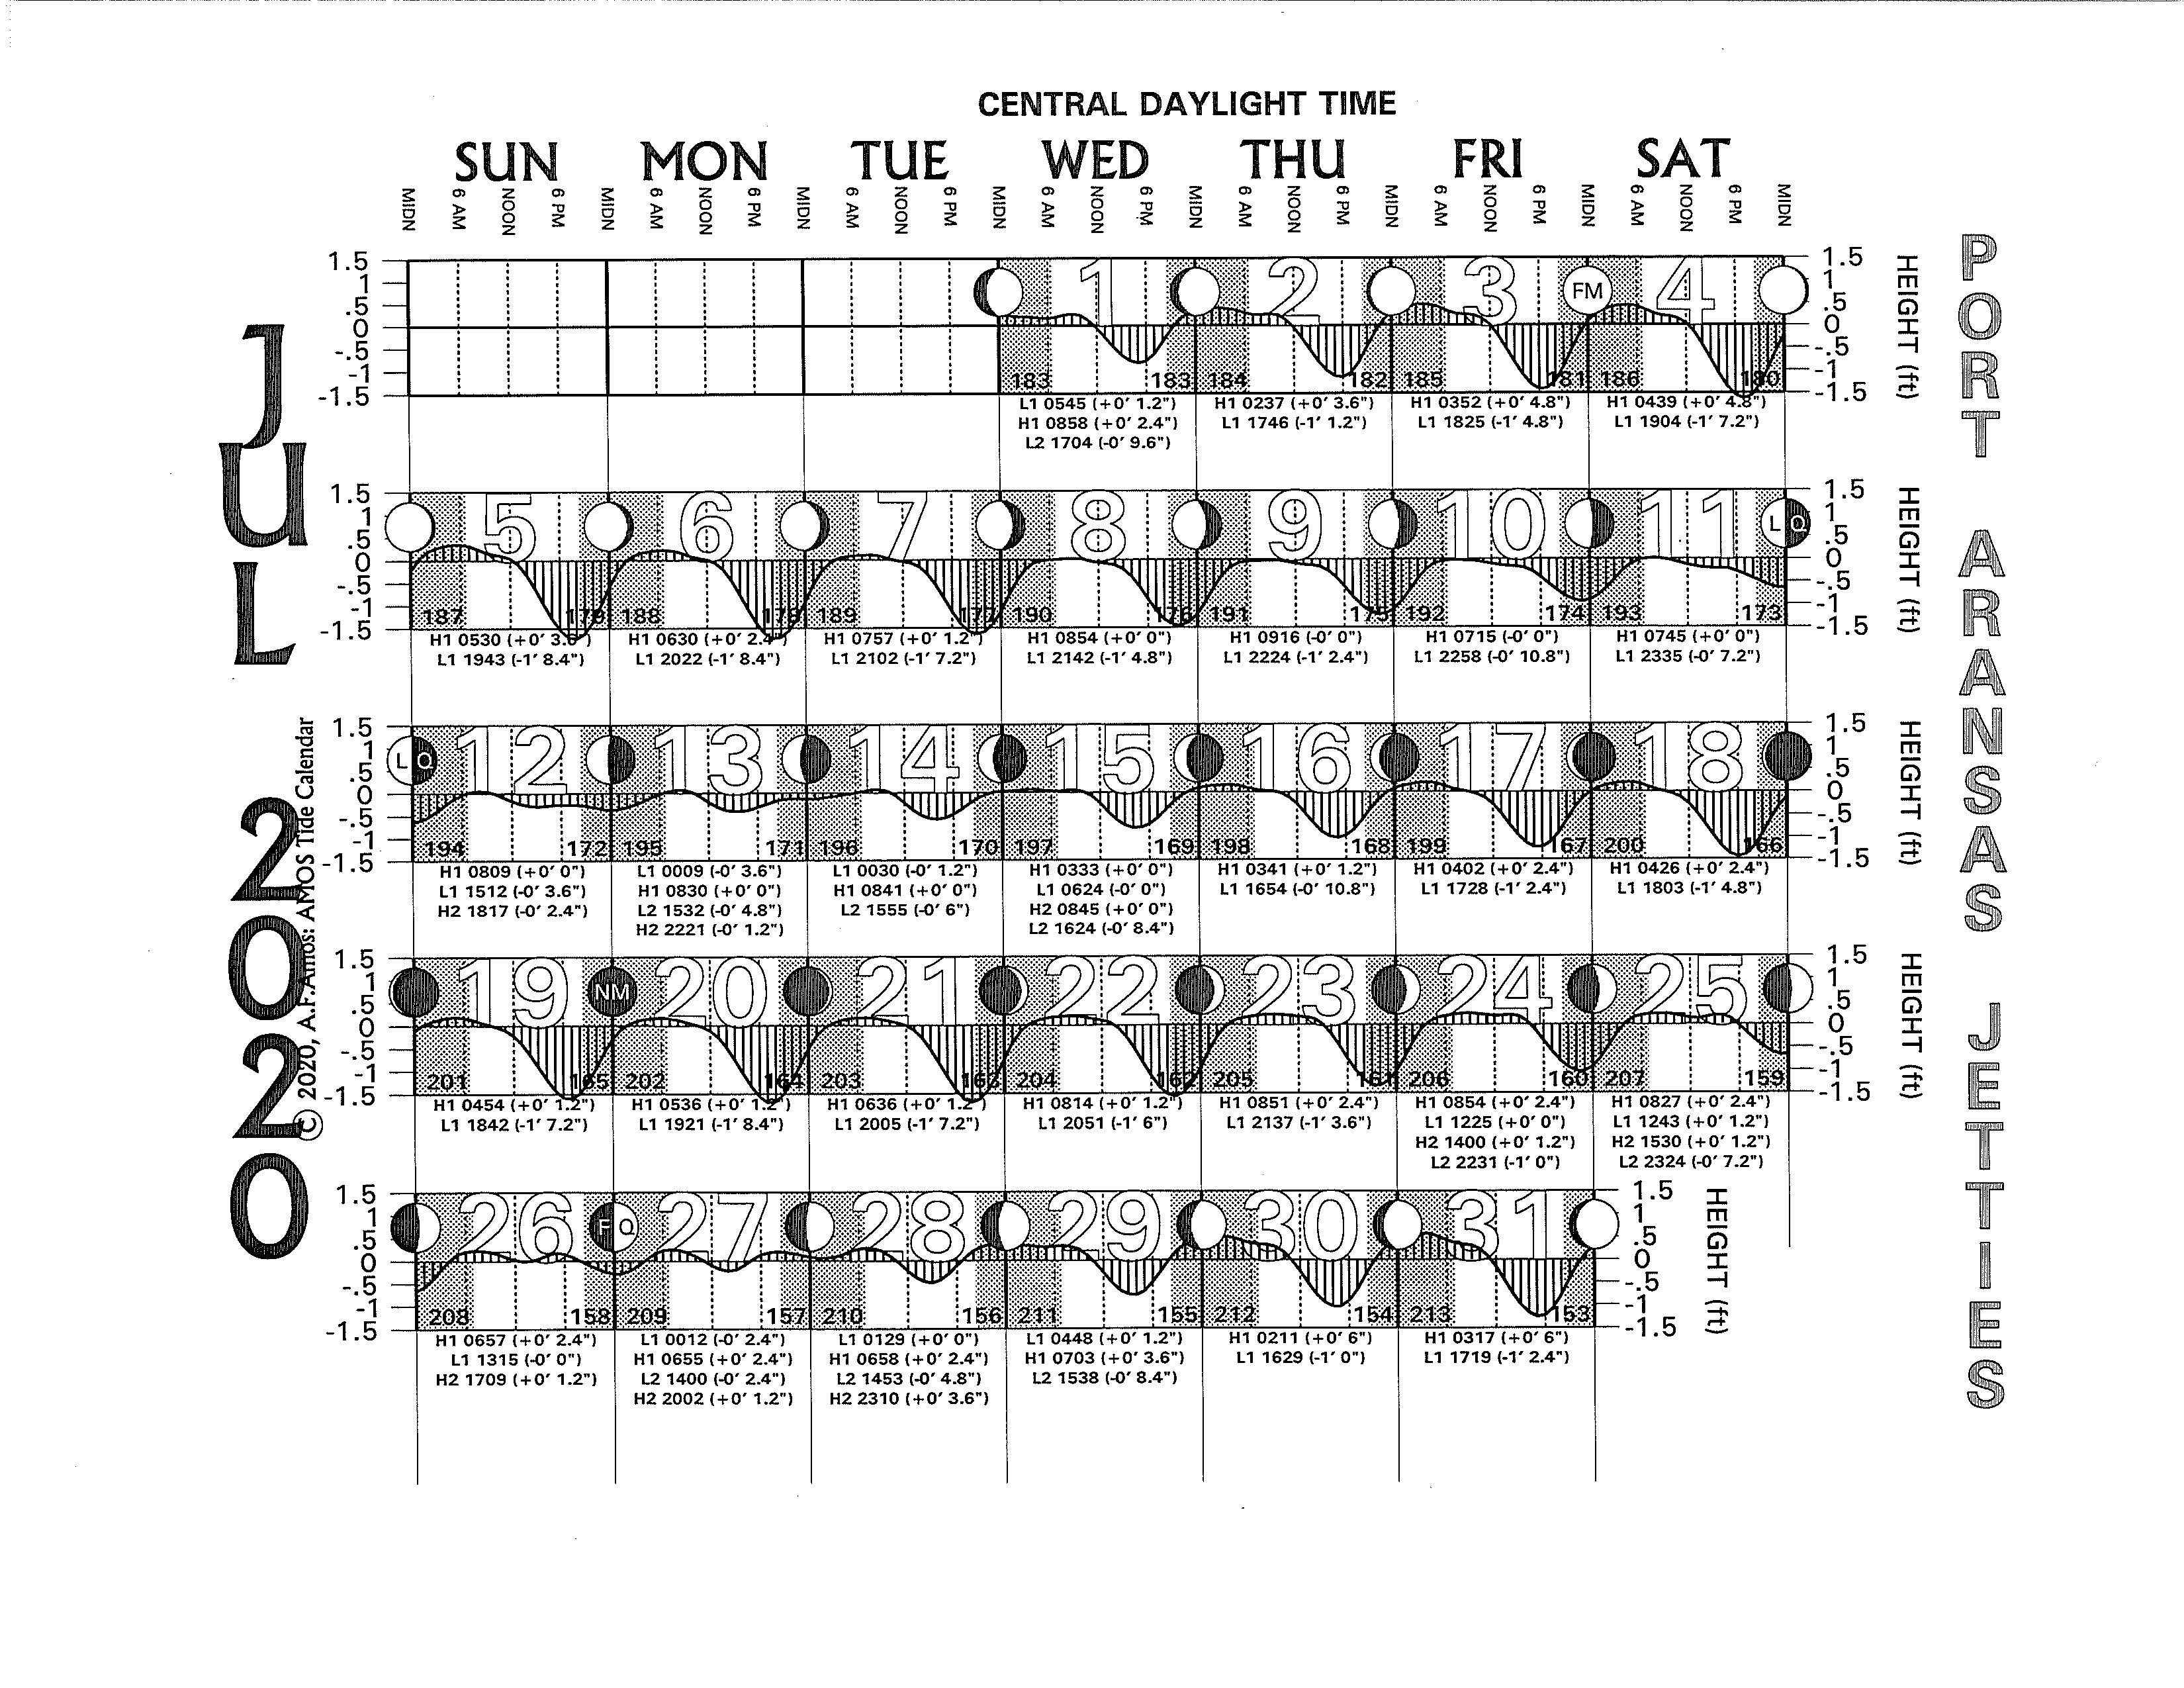
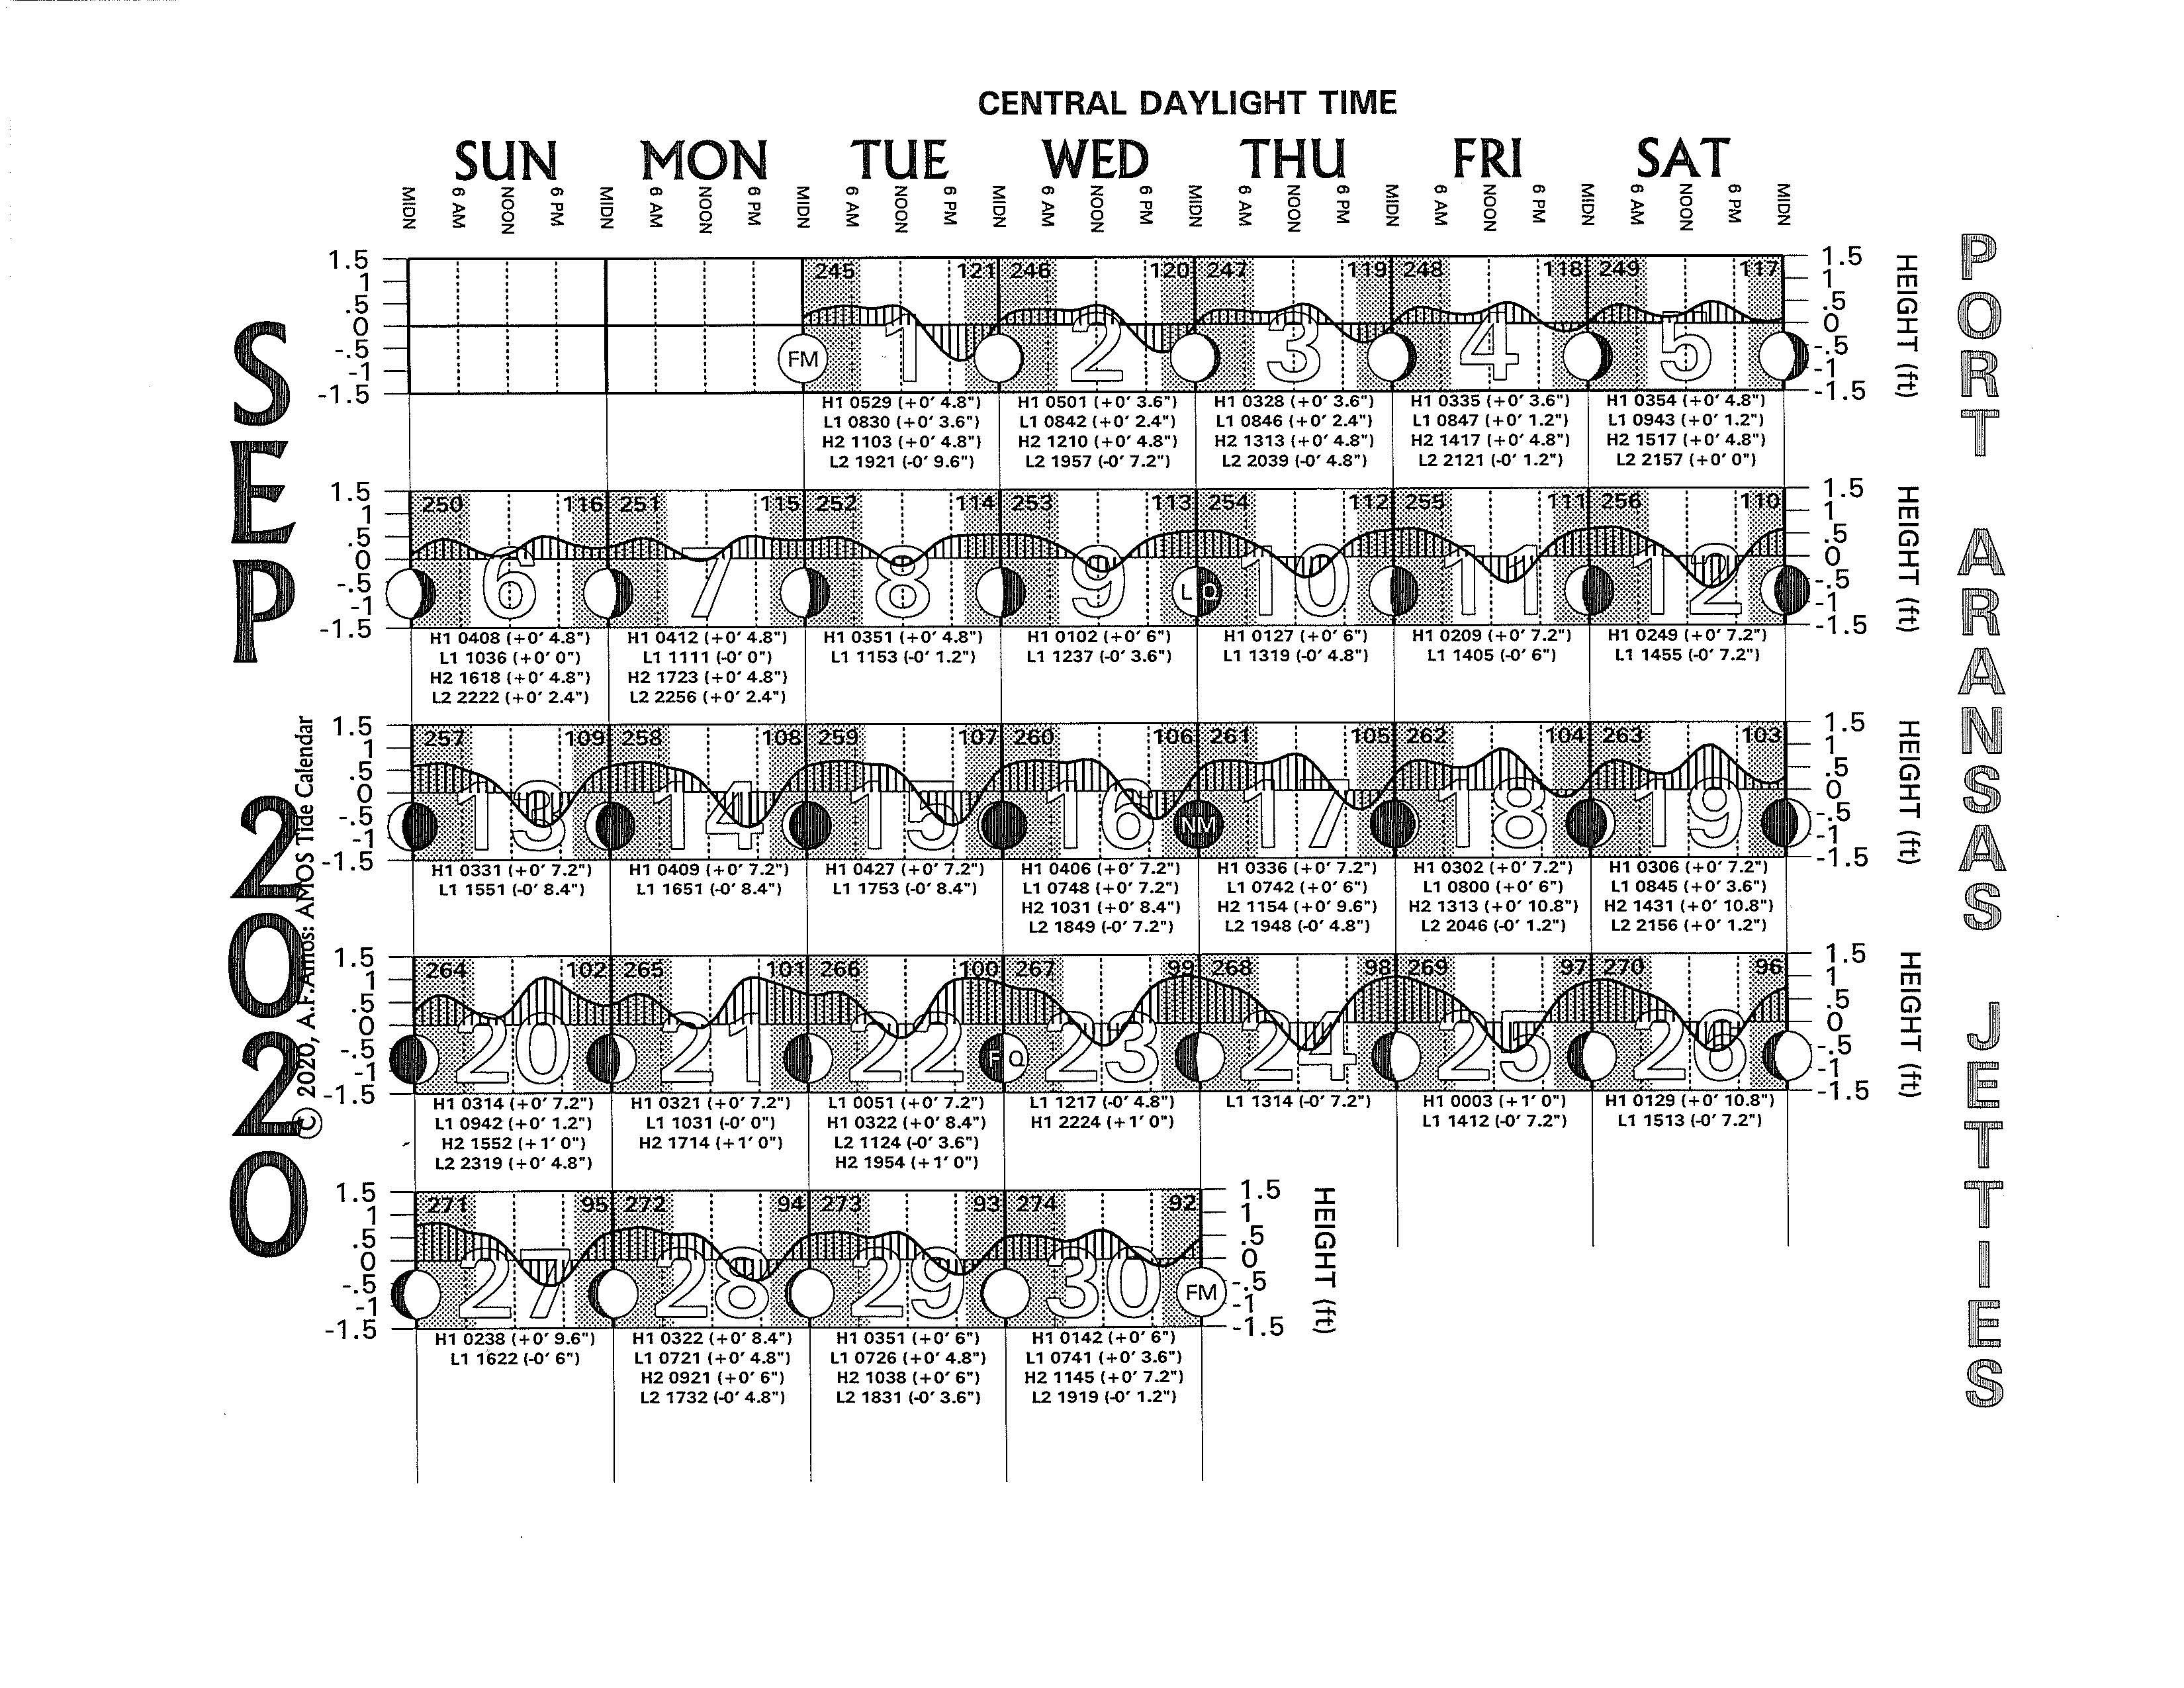
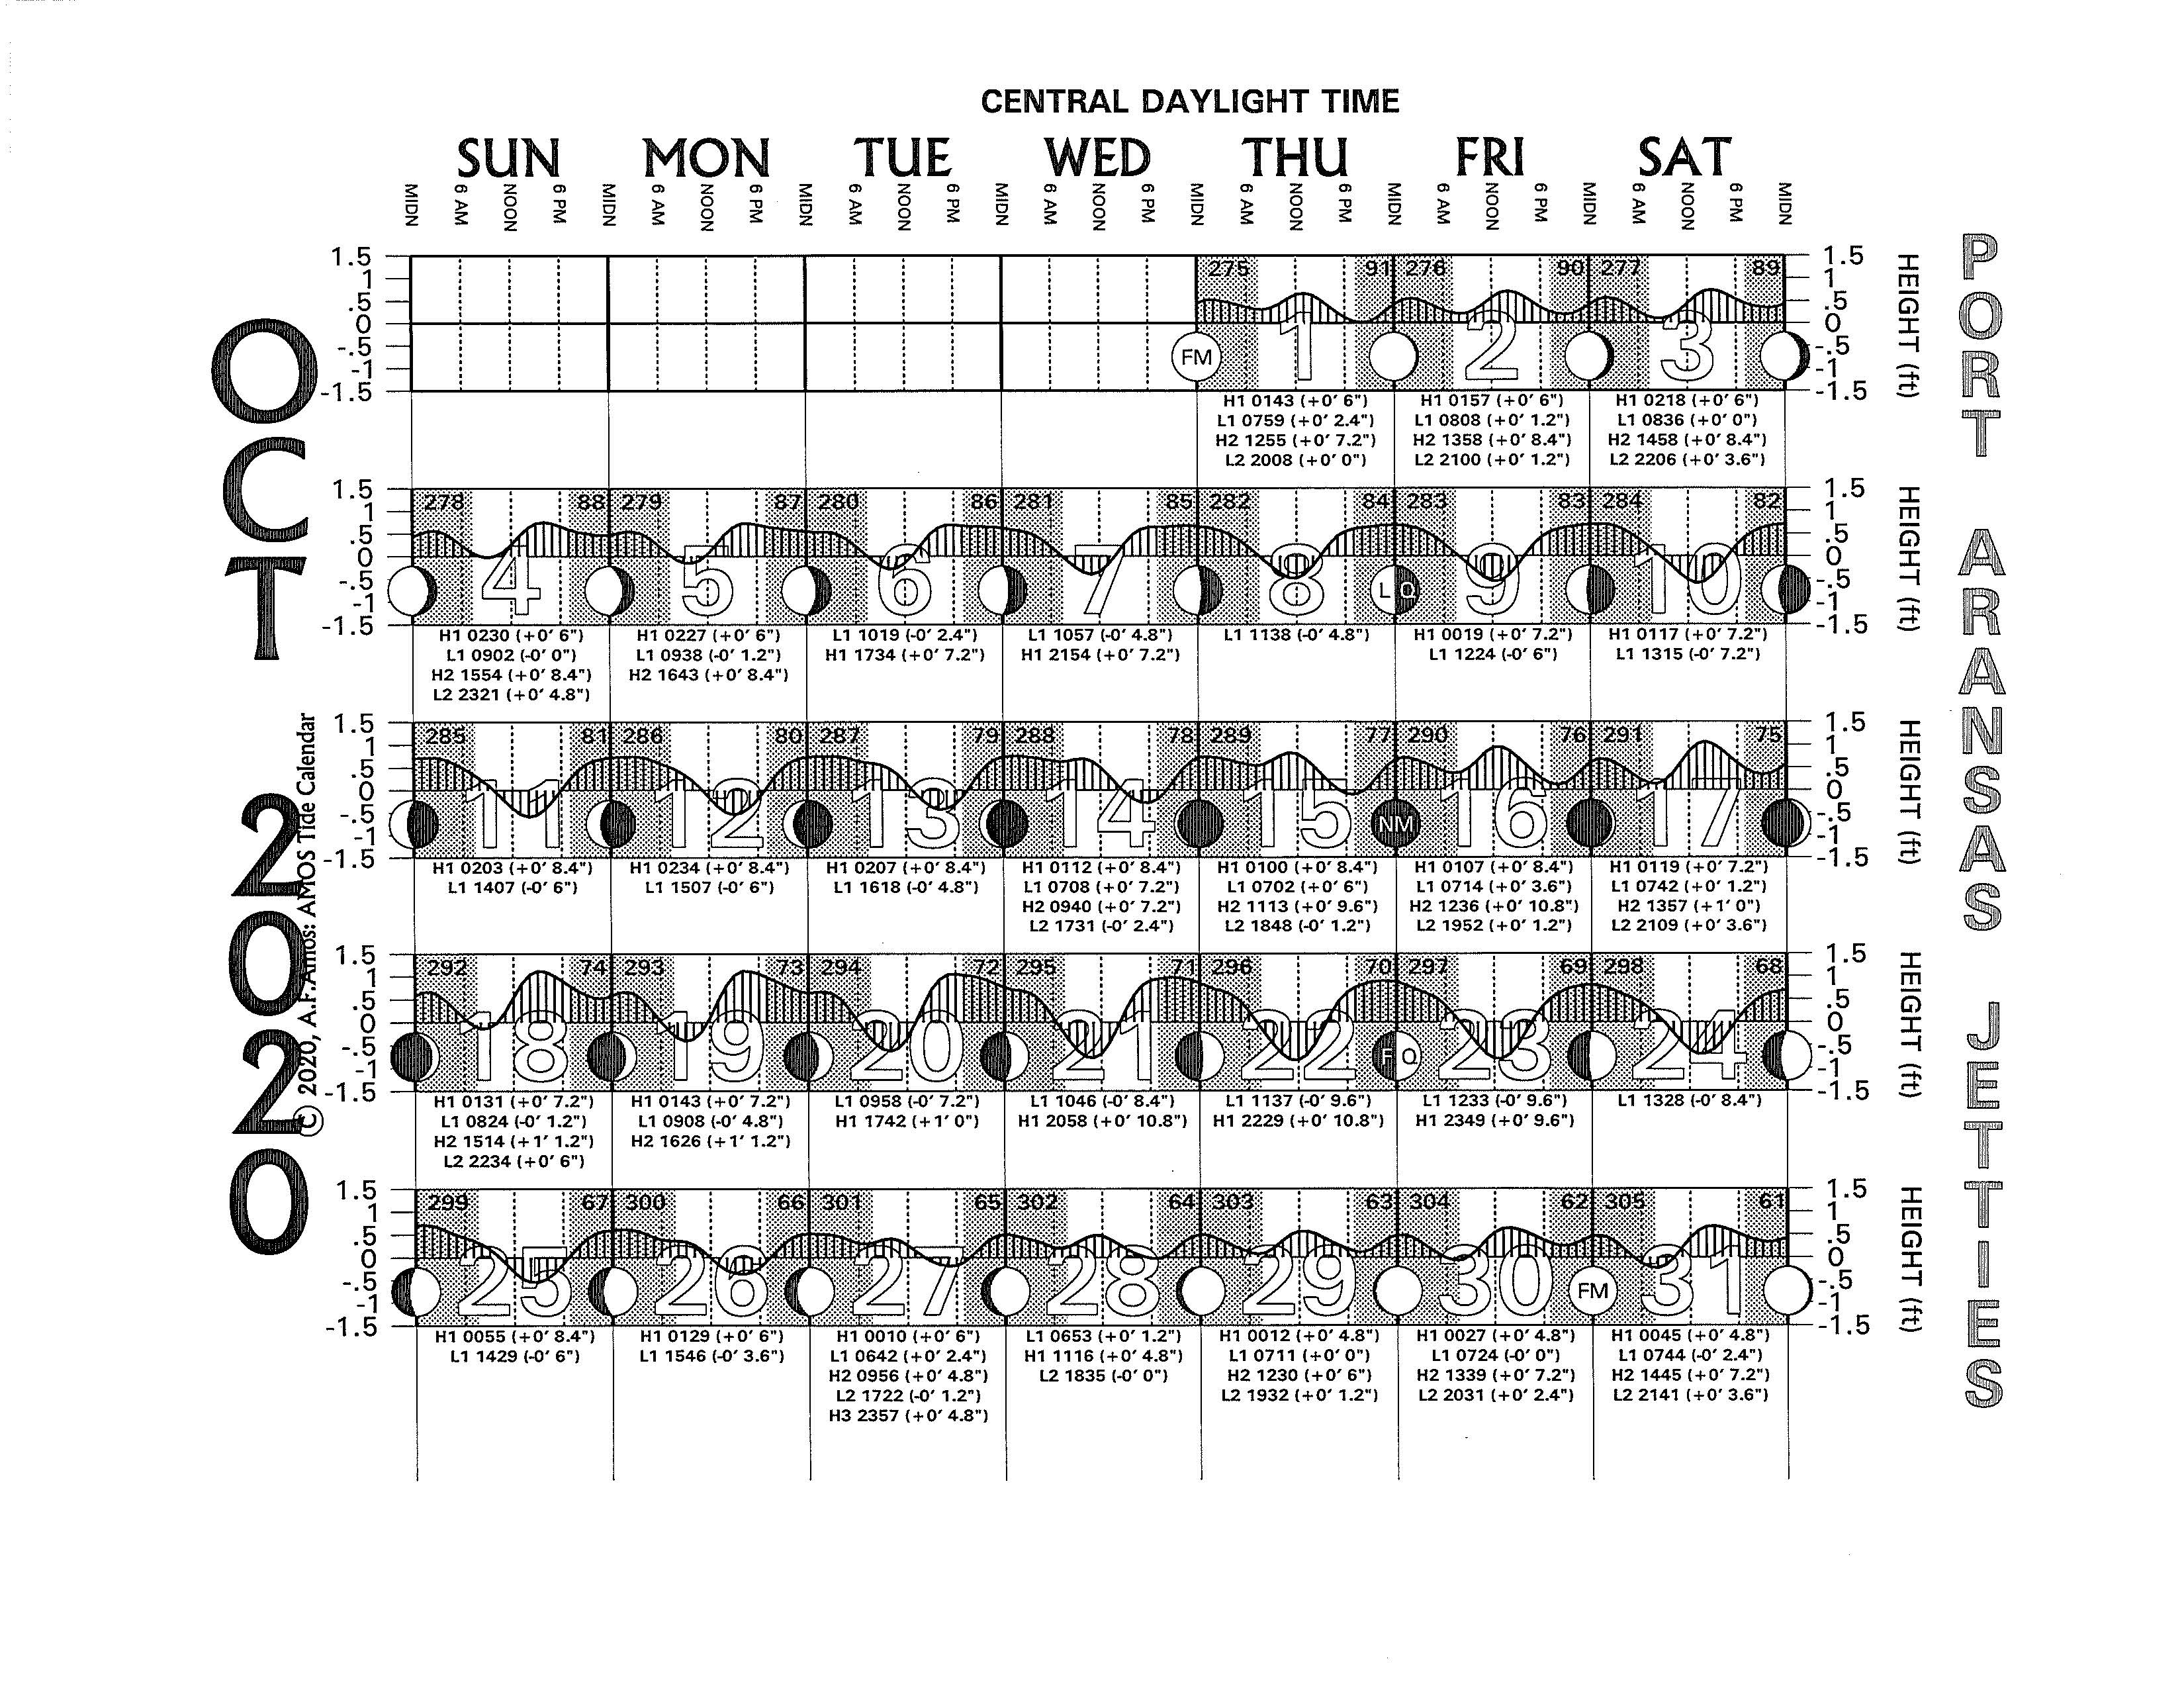
2020 Tide Charts - Texas Tides: Port Aransas Jetties
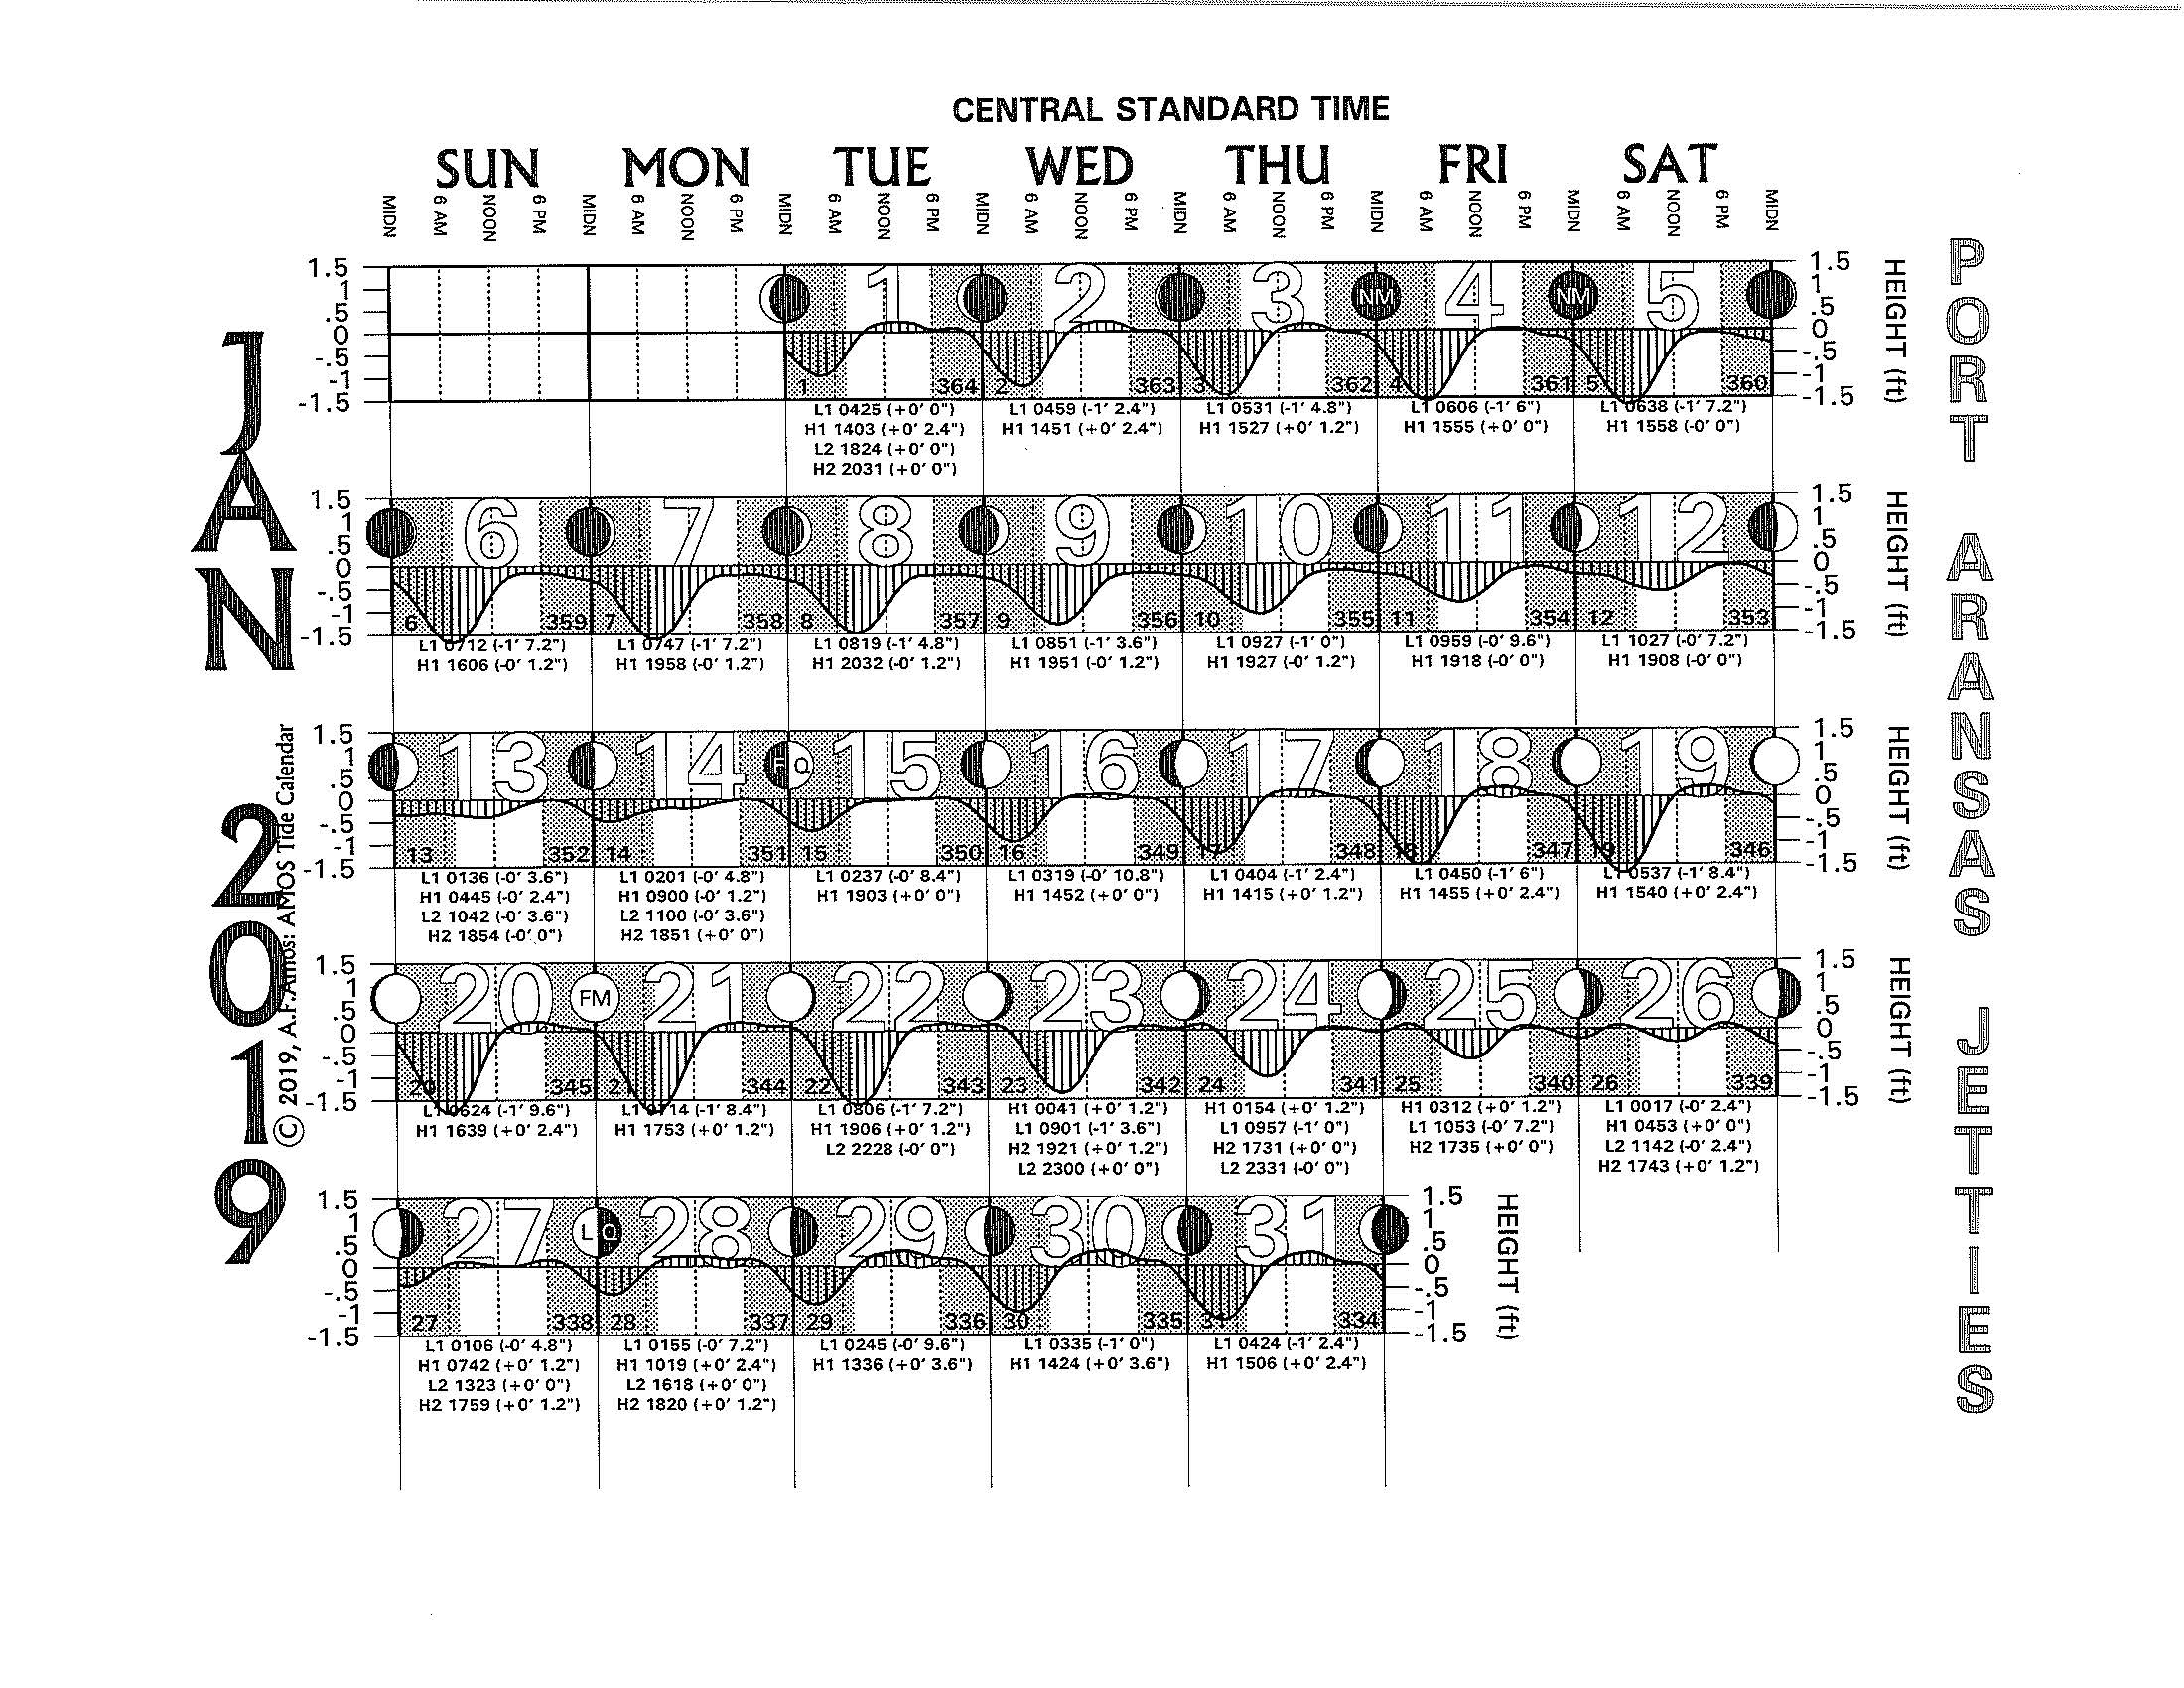
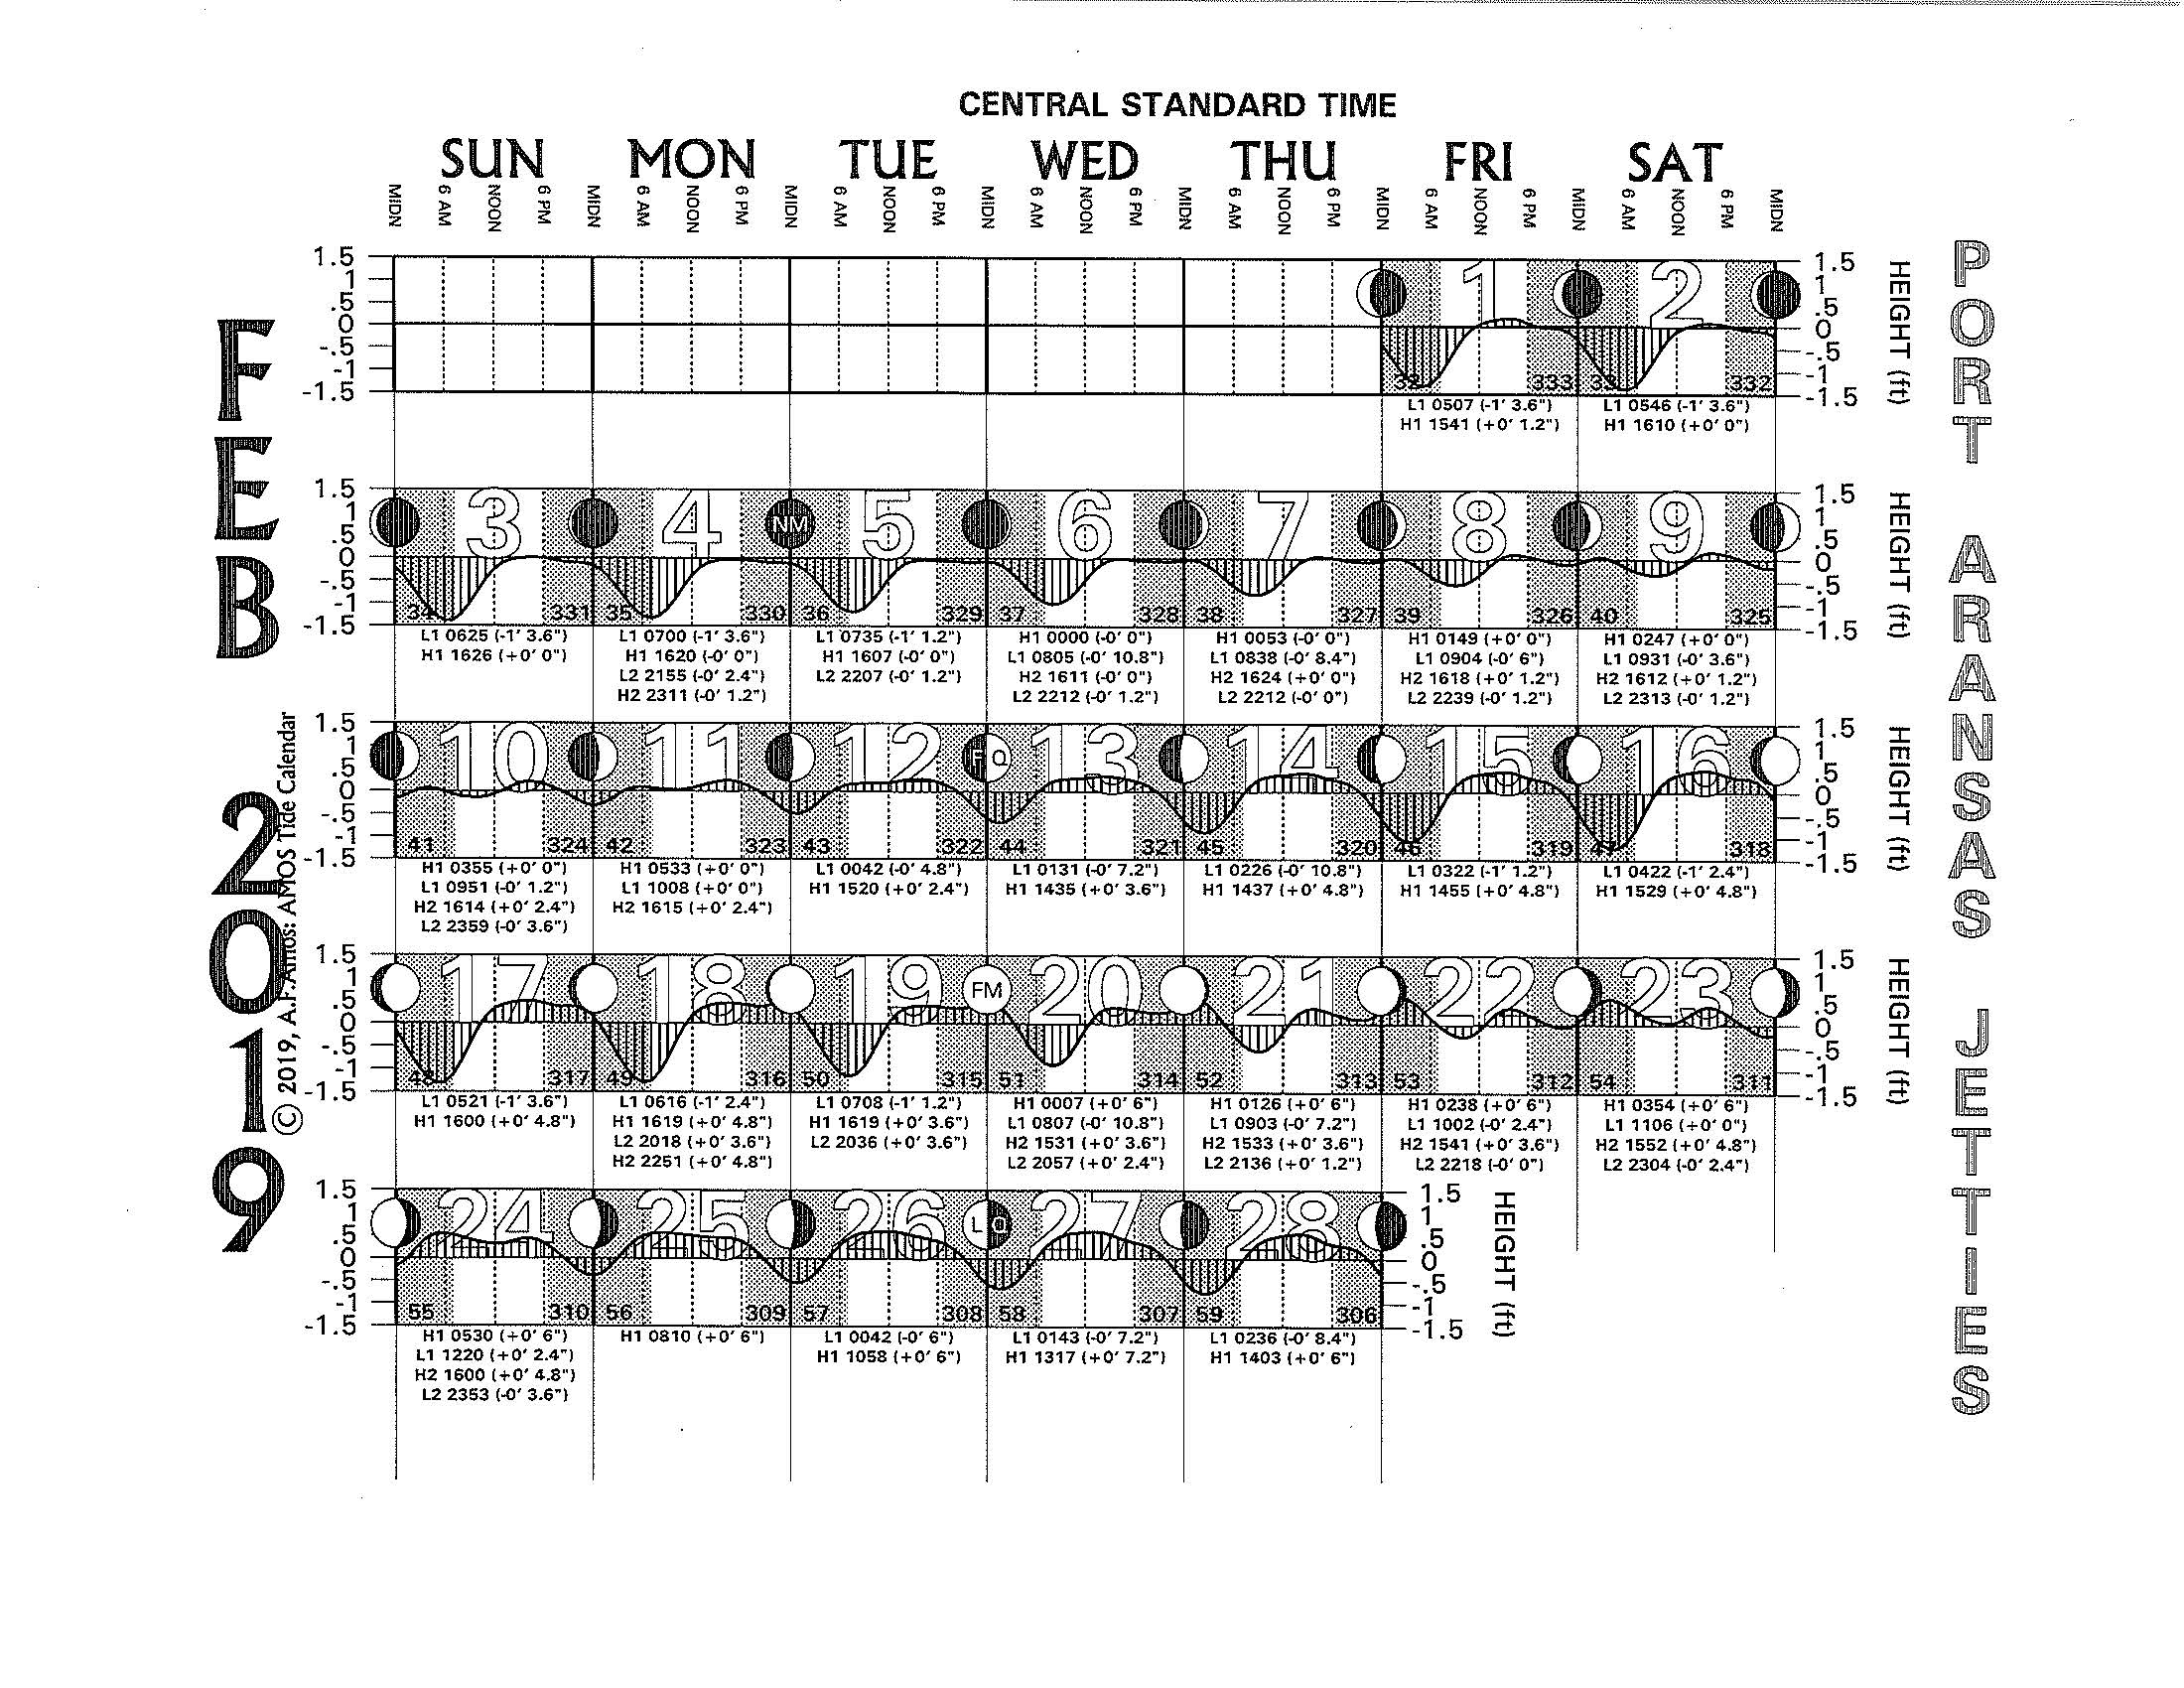
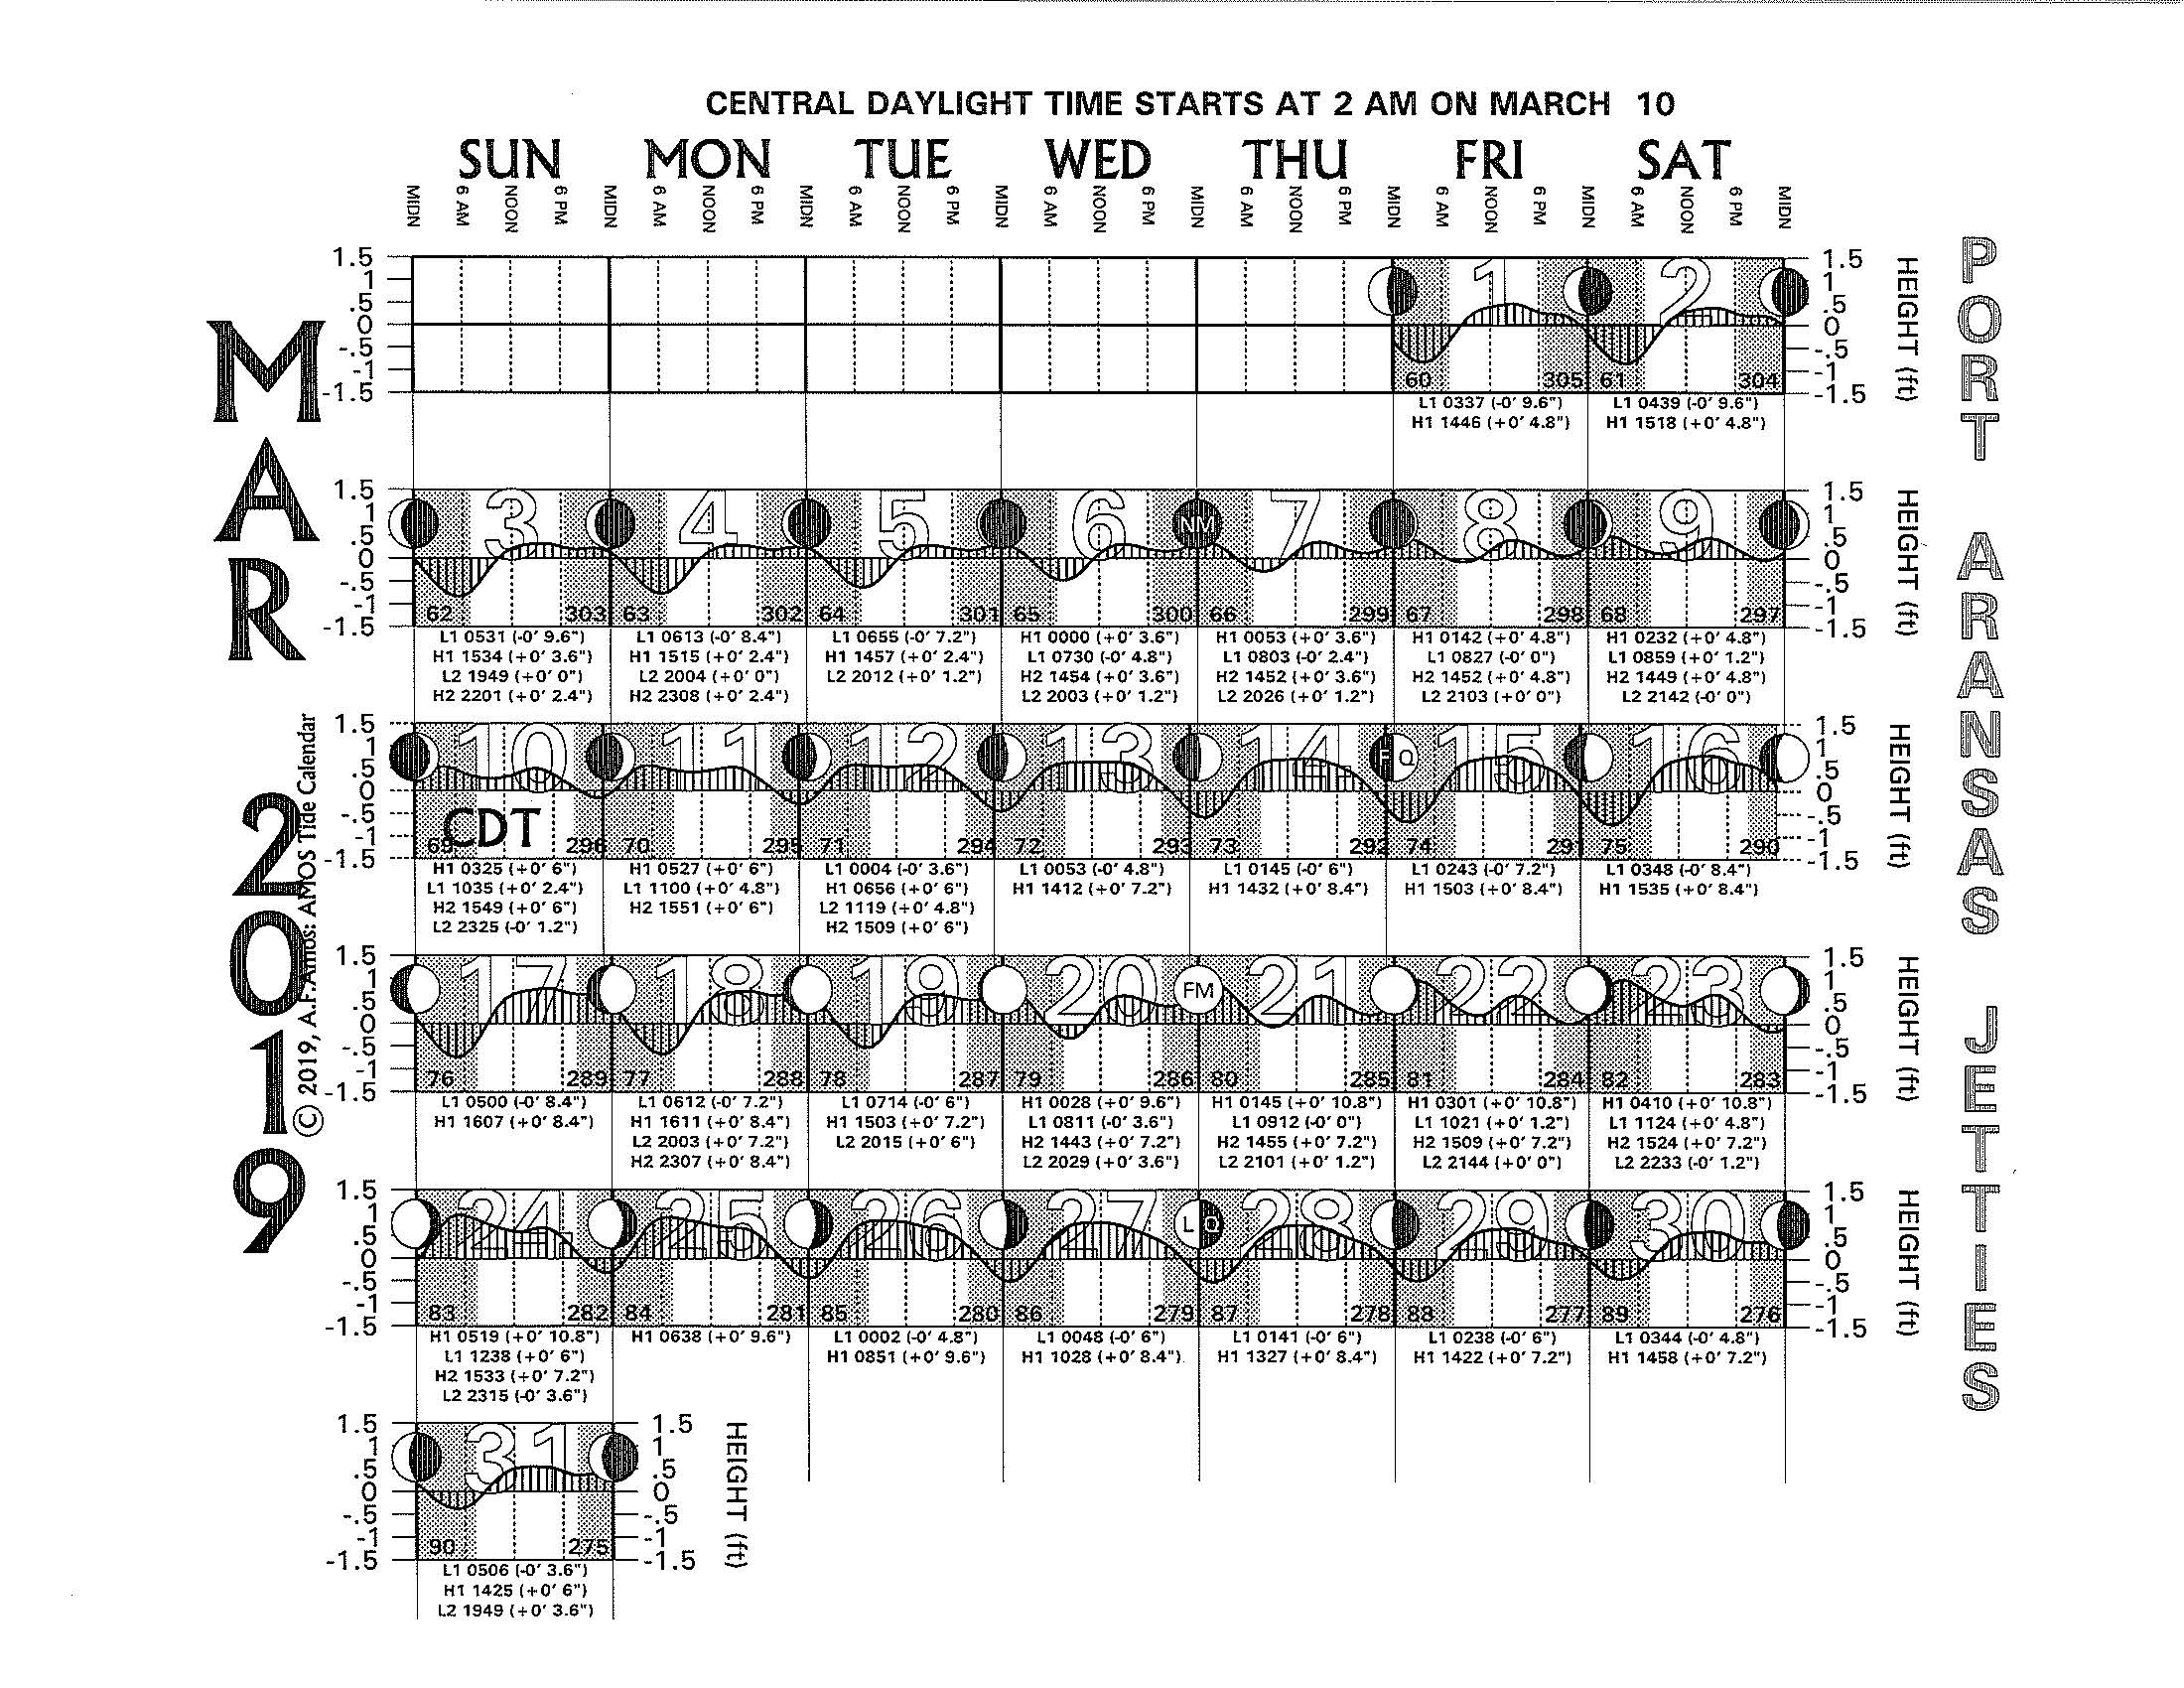
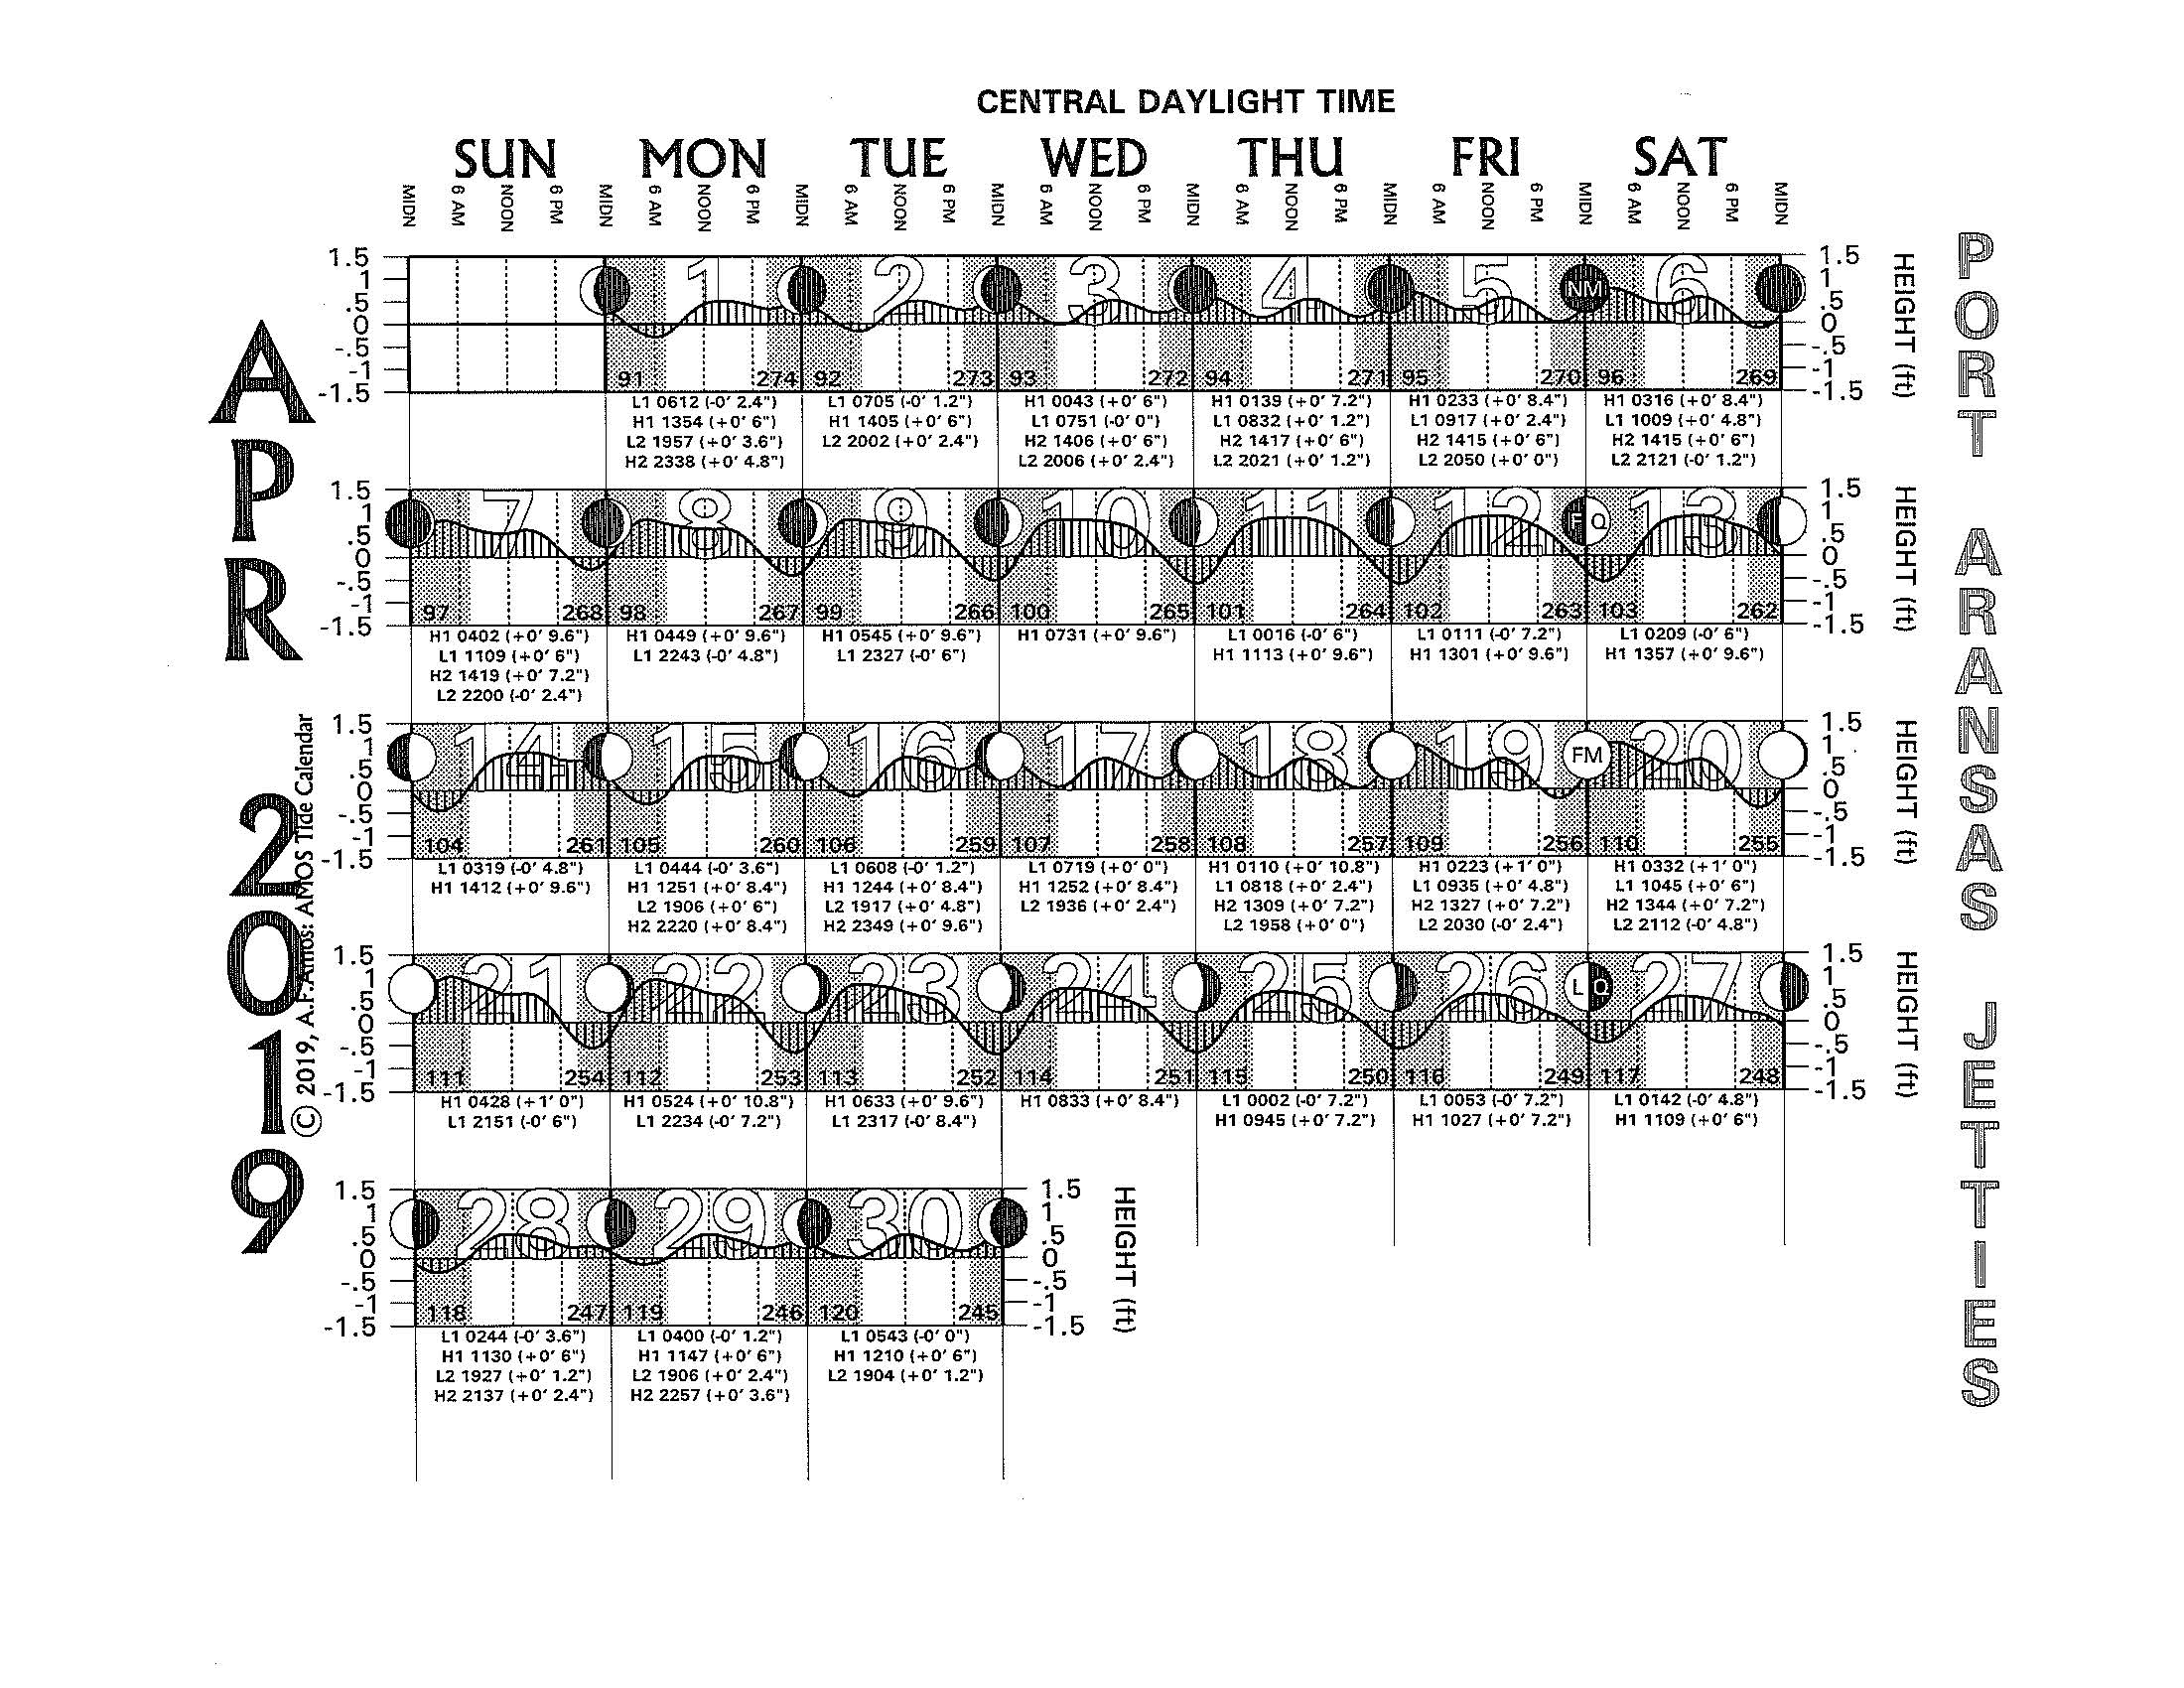
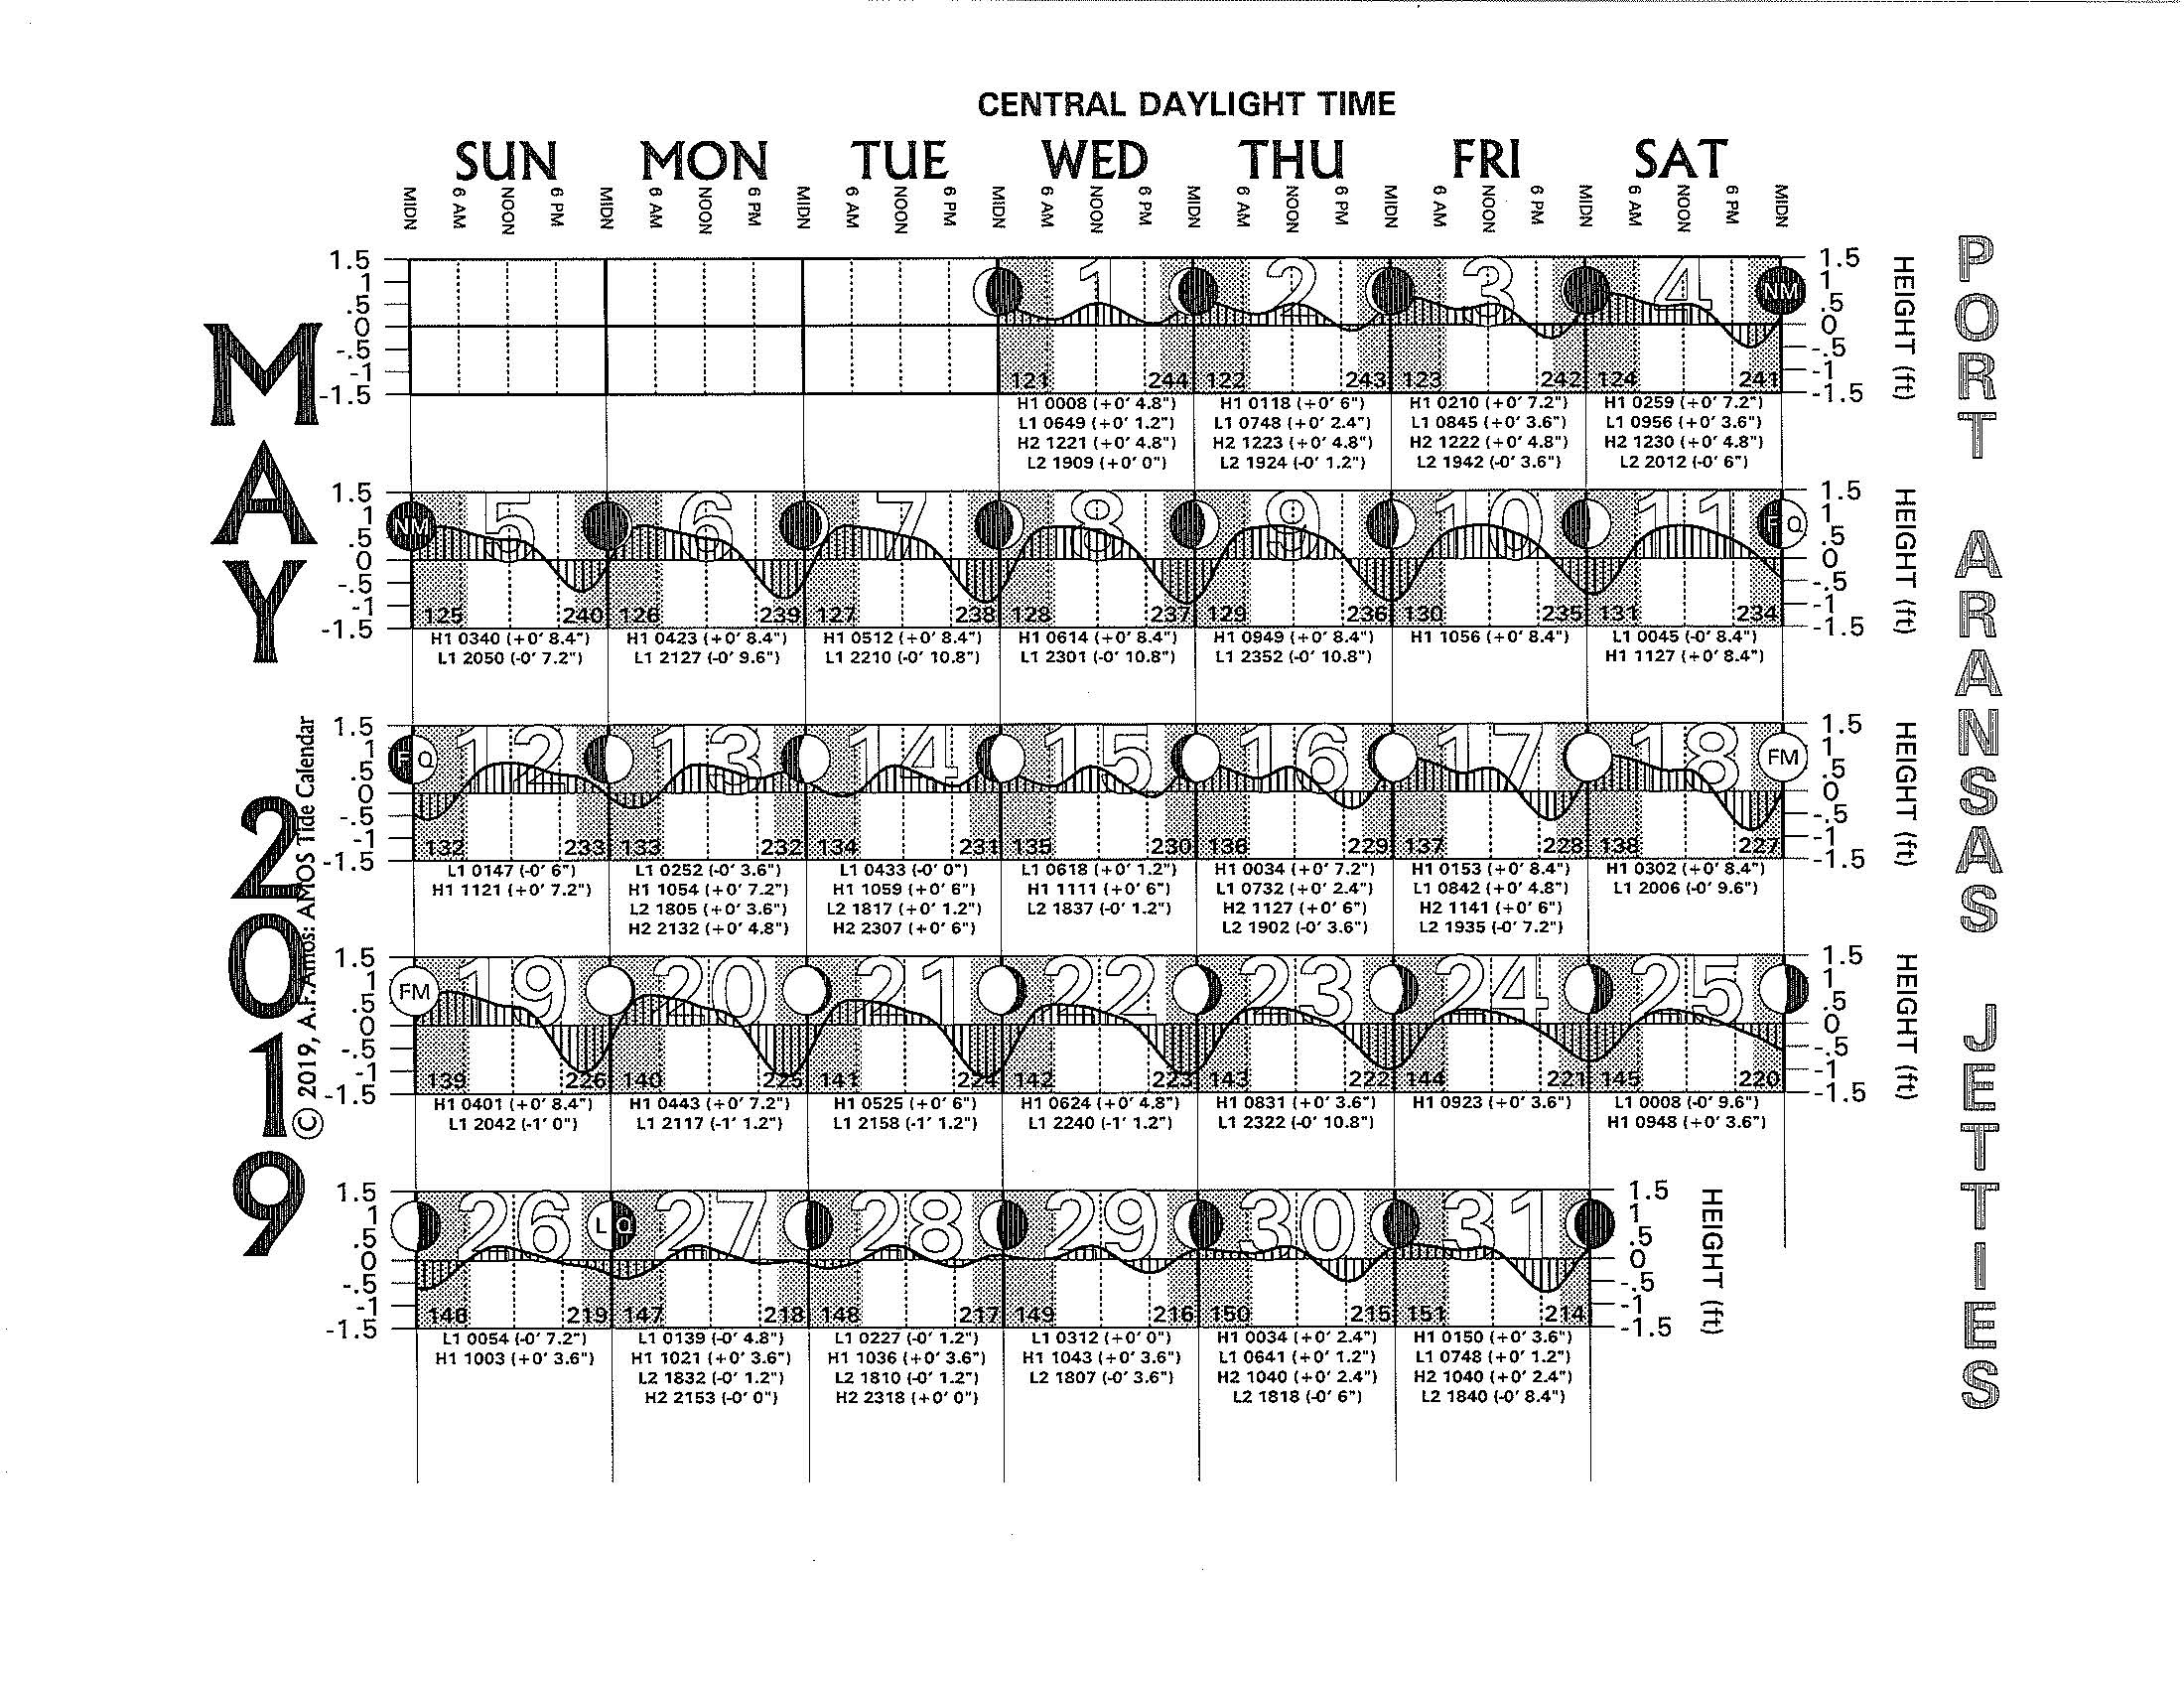
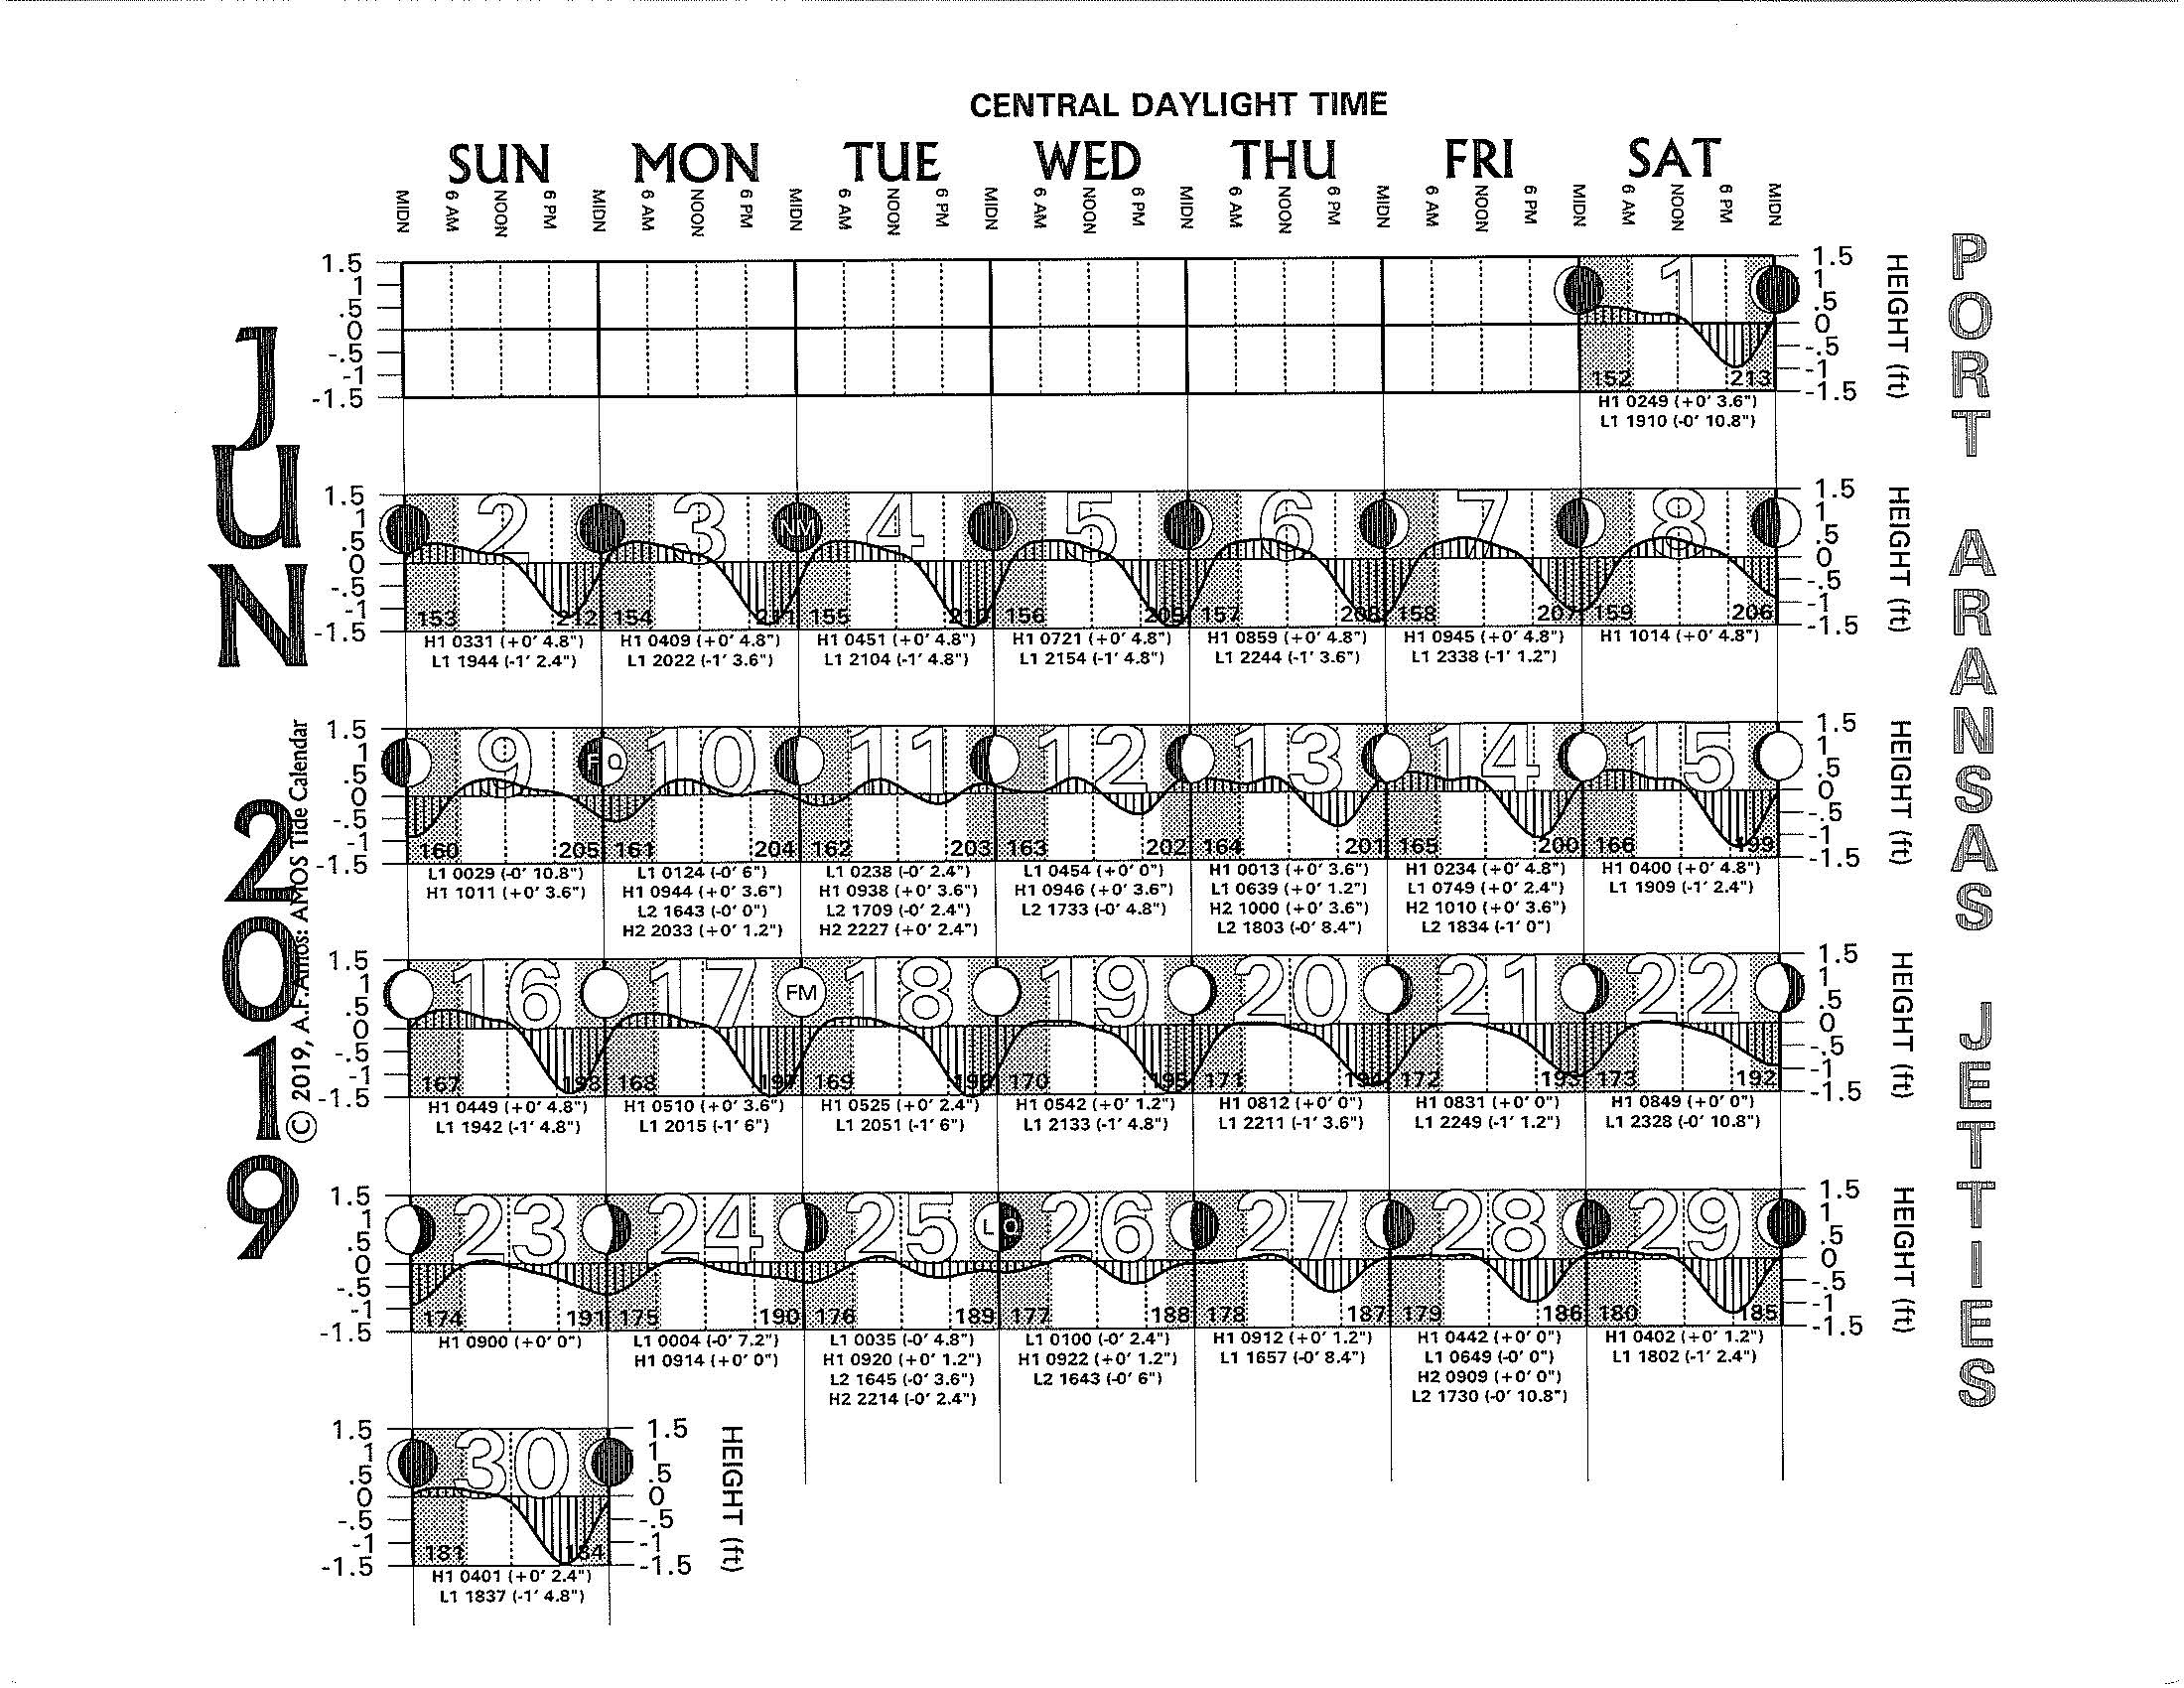
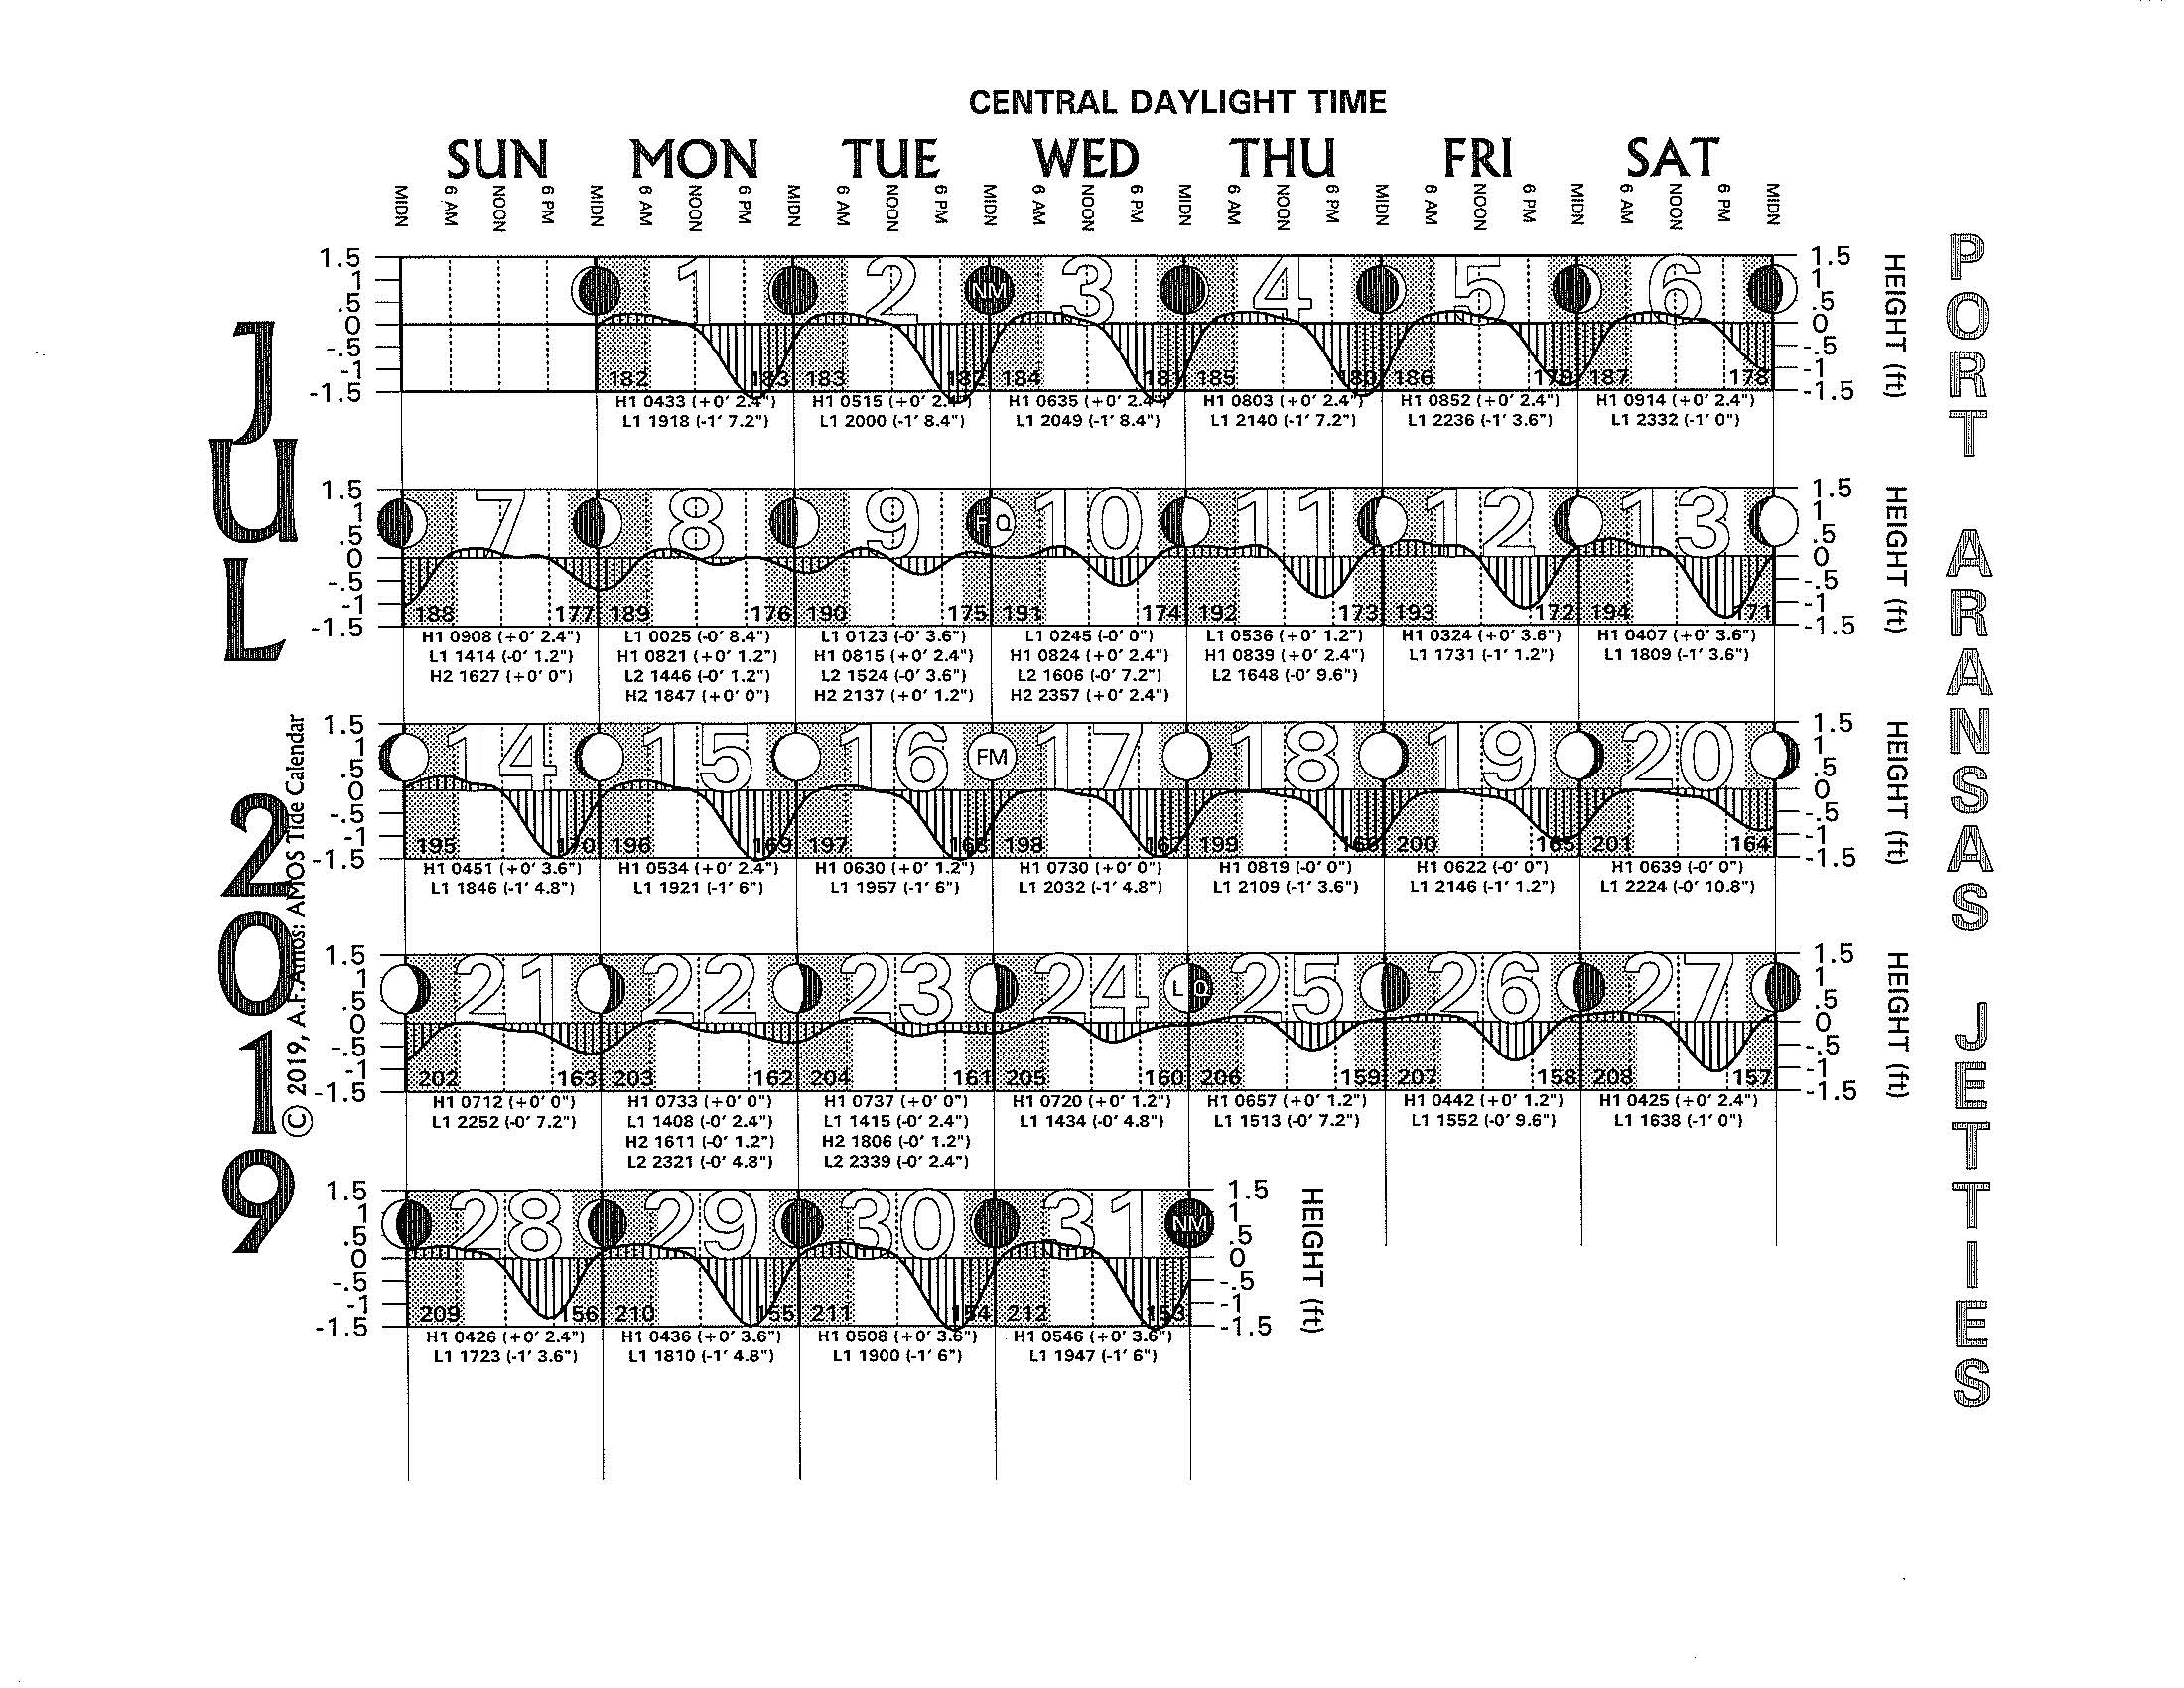
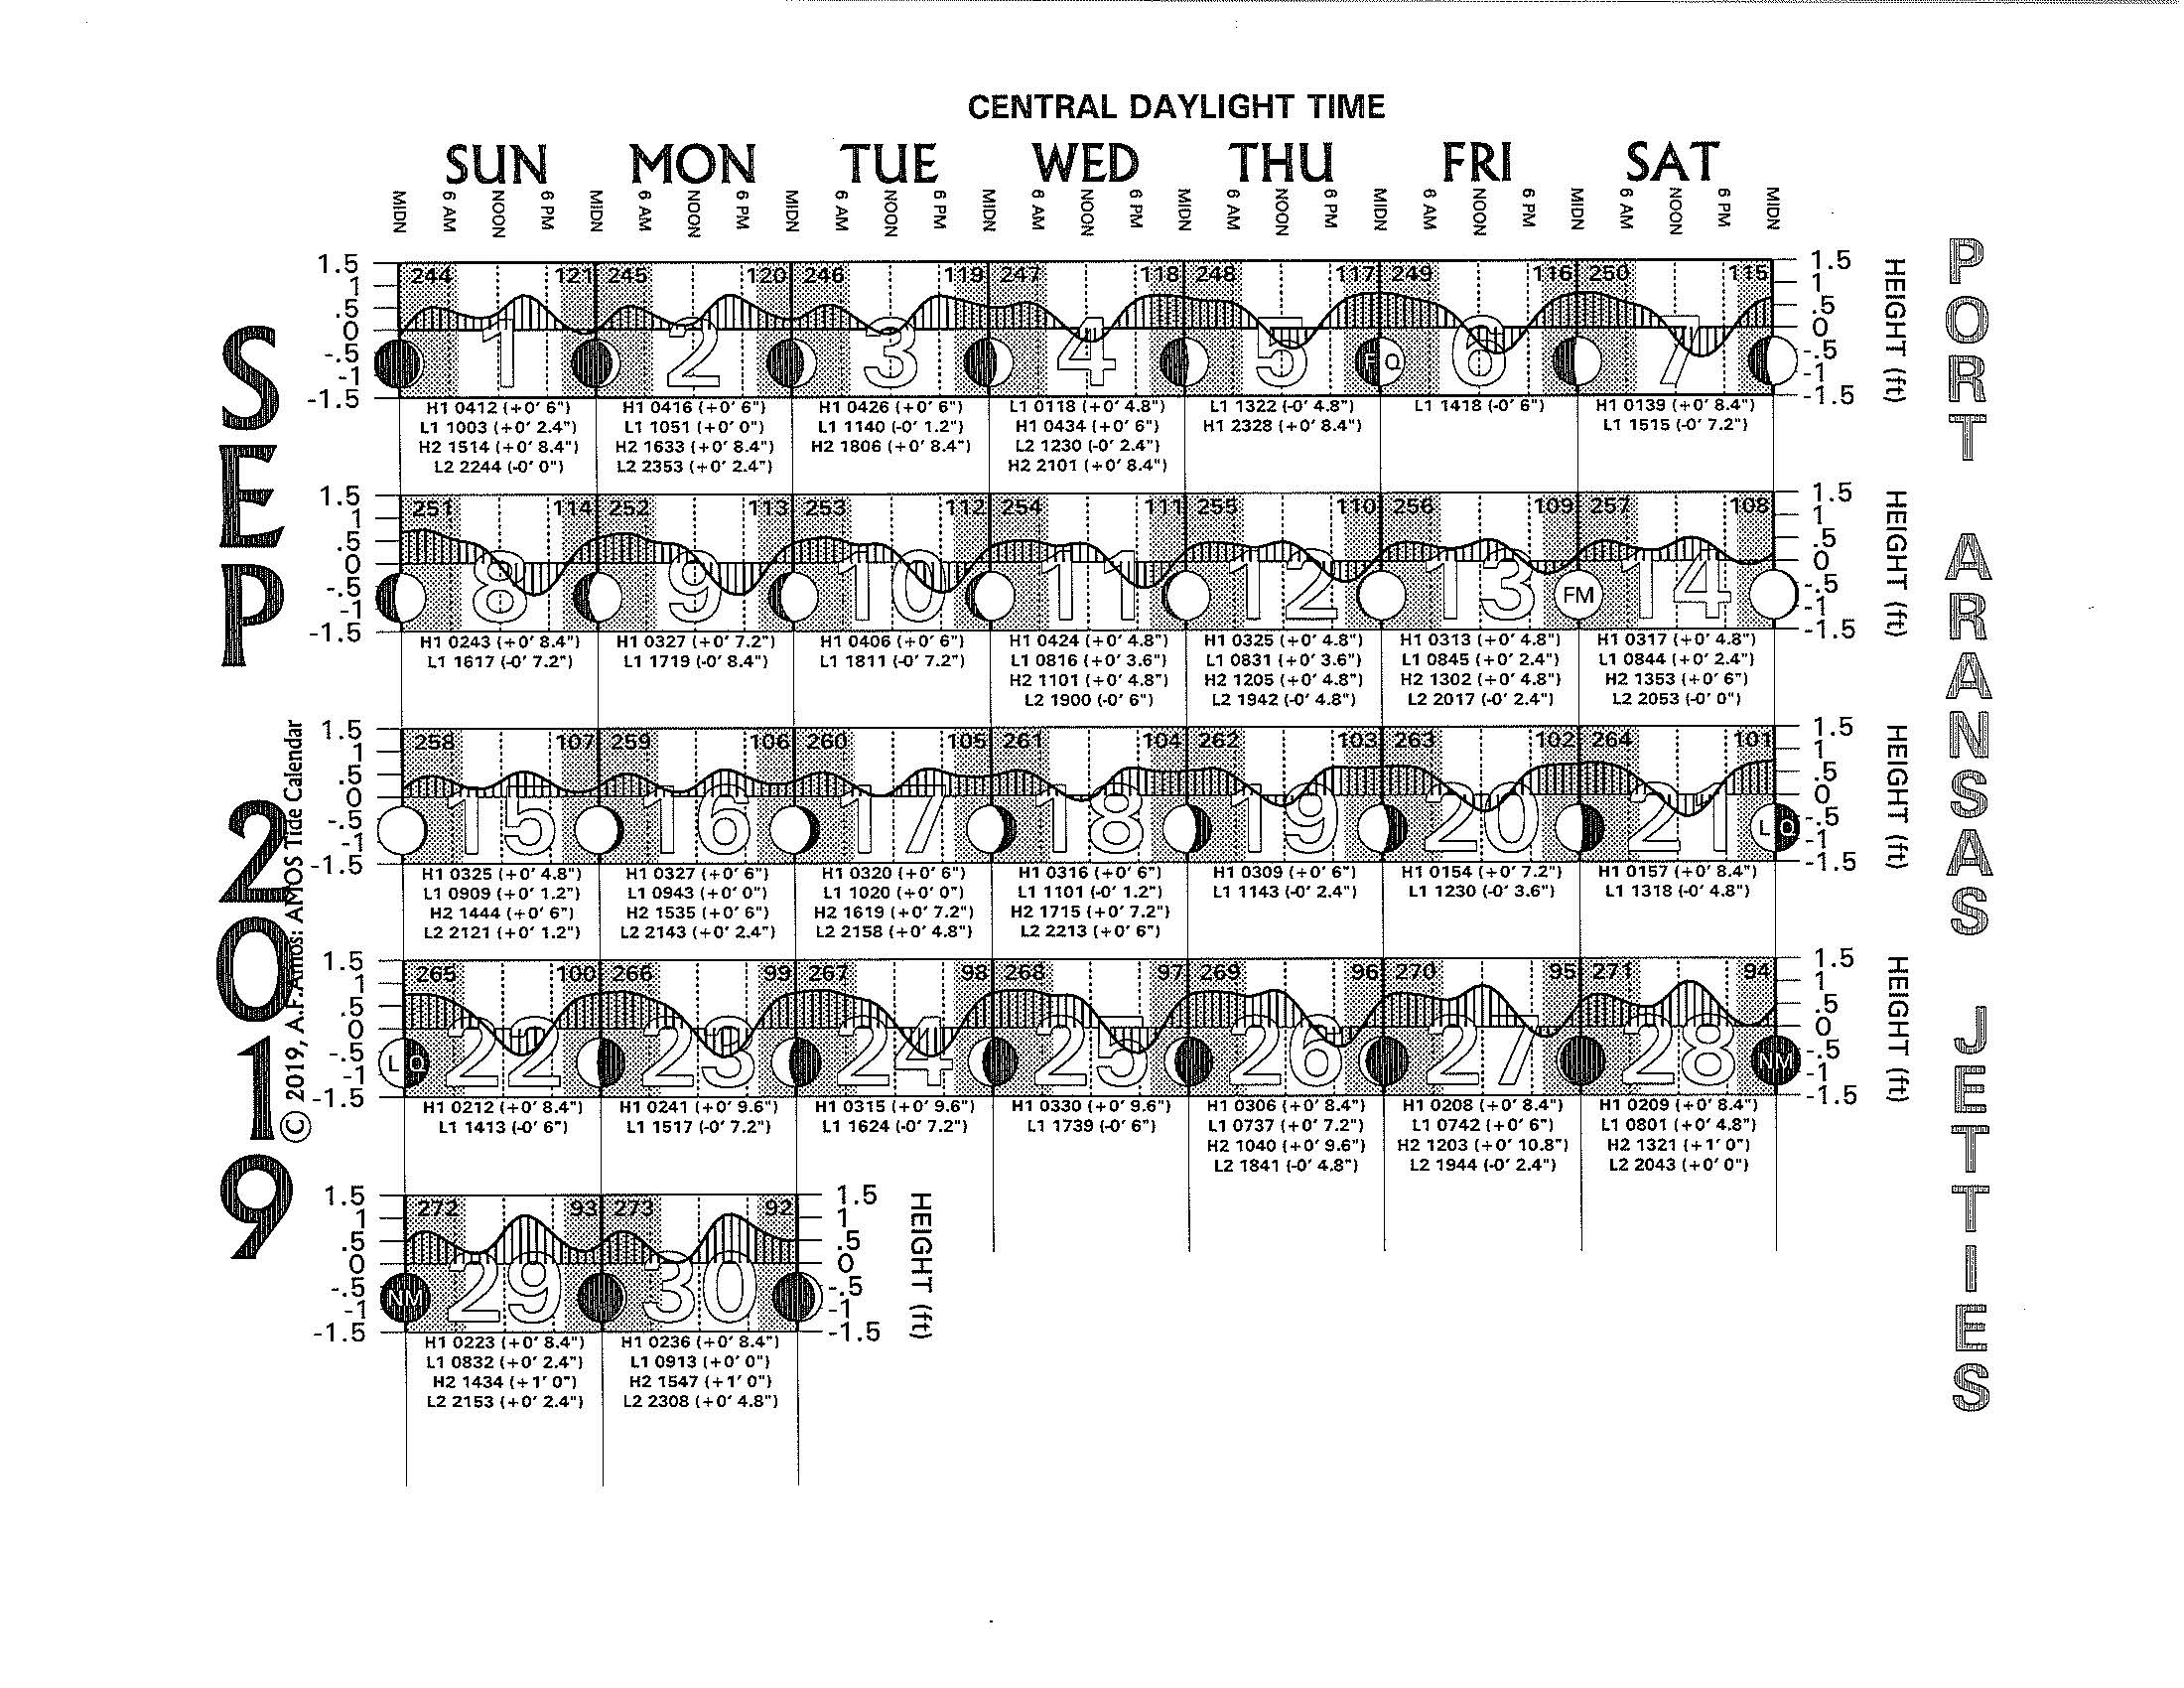
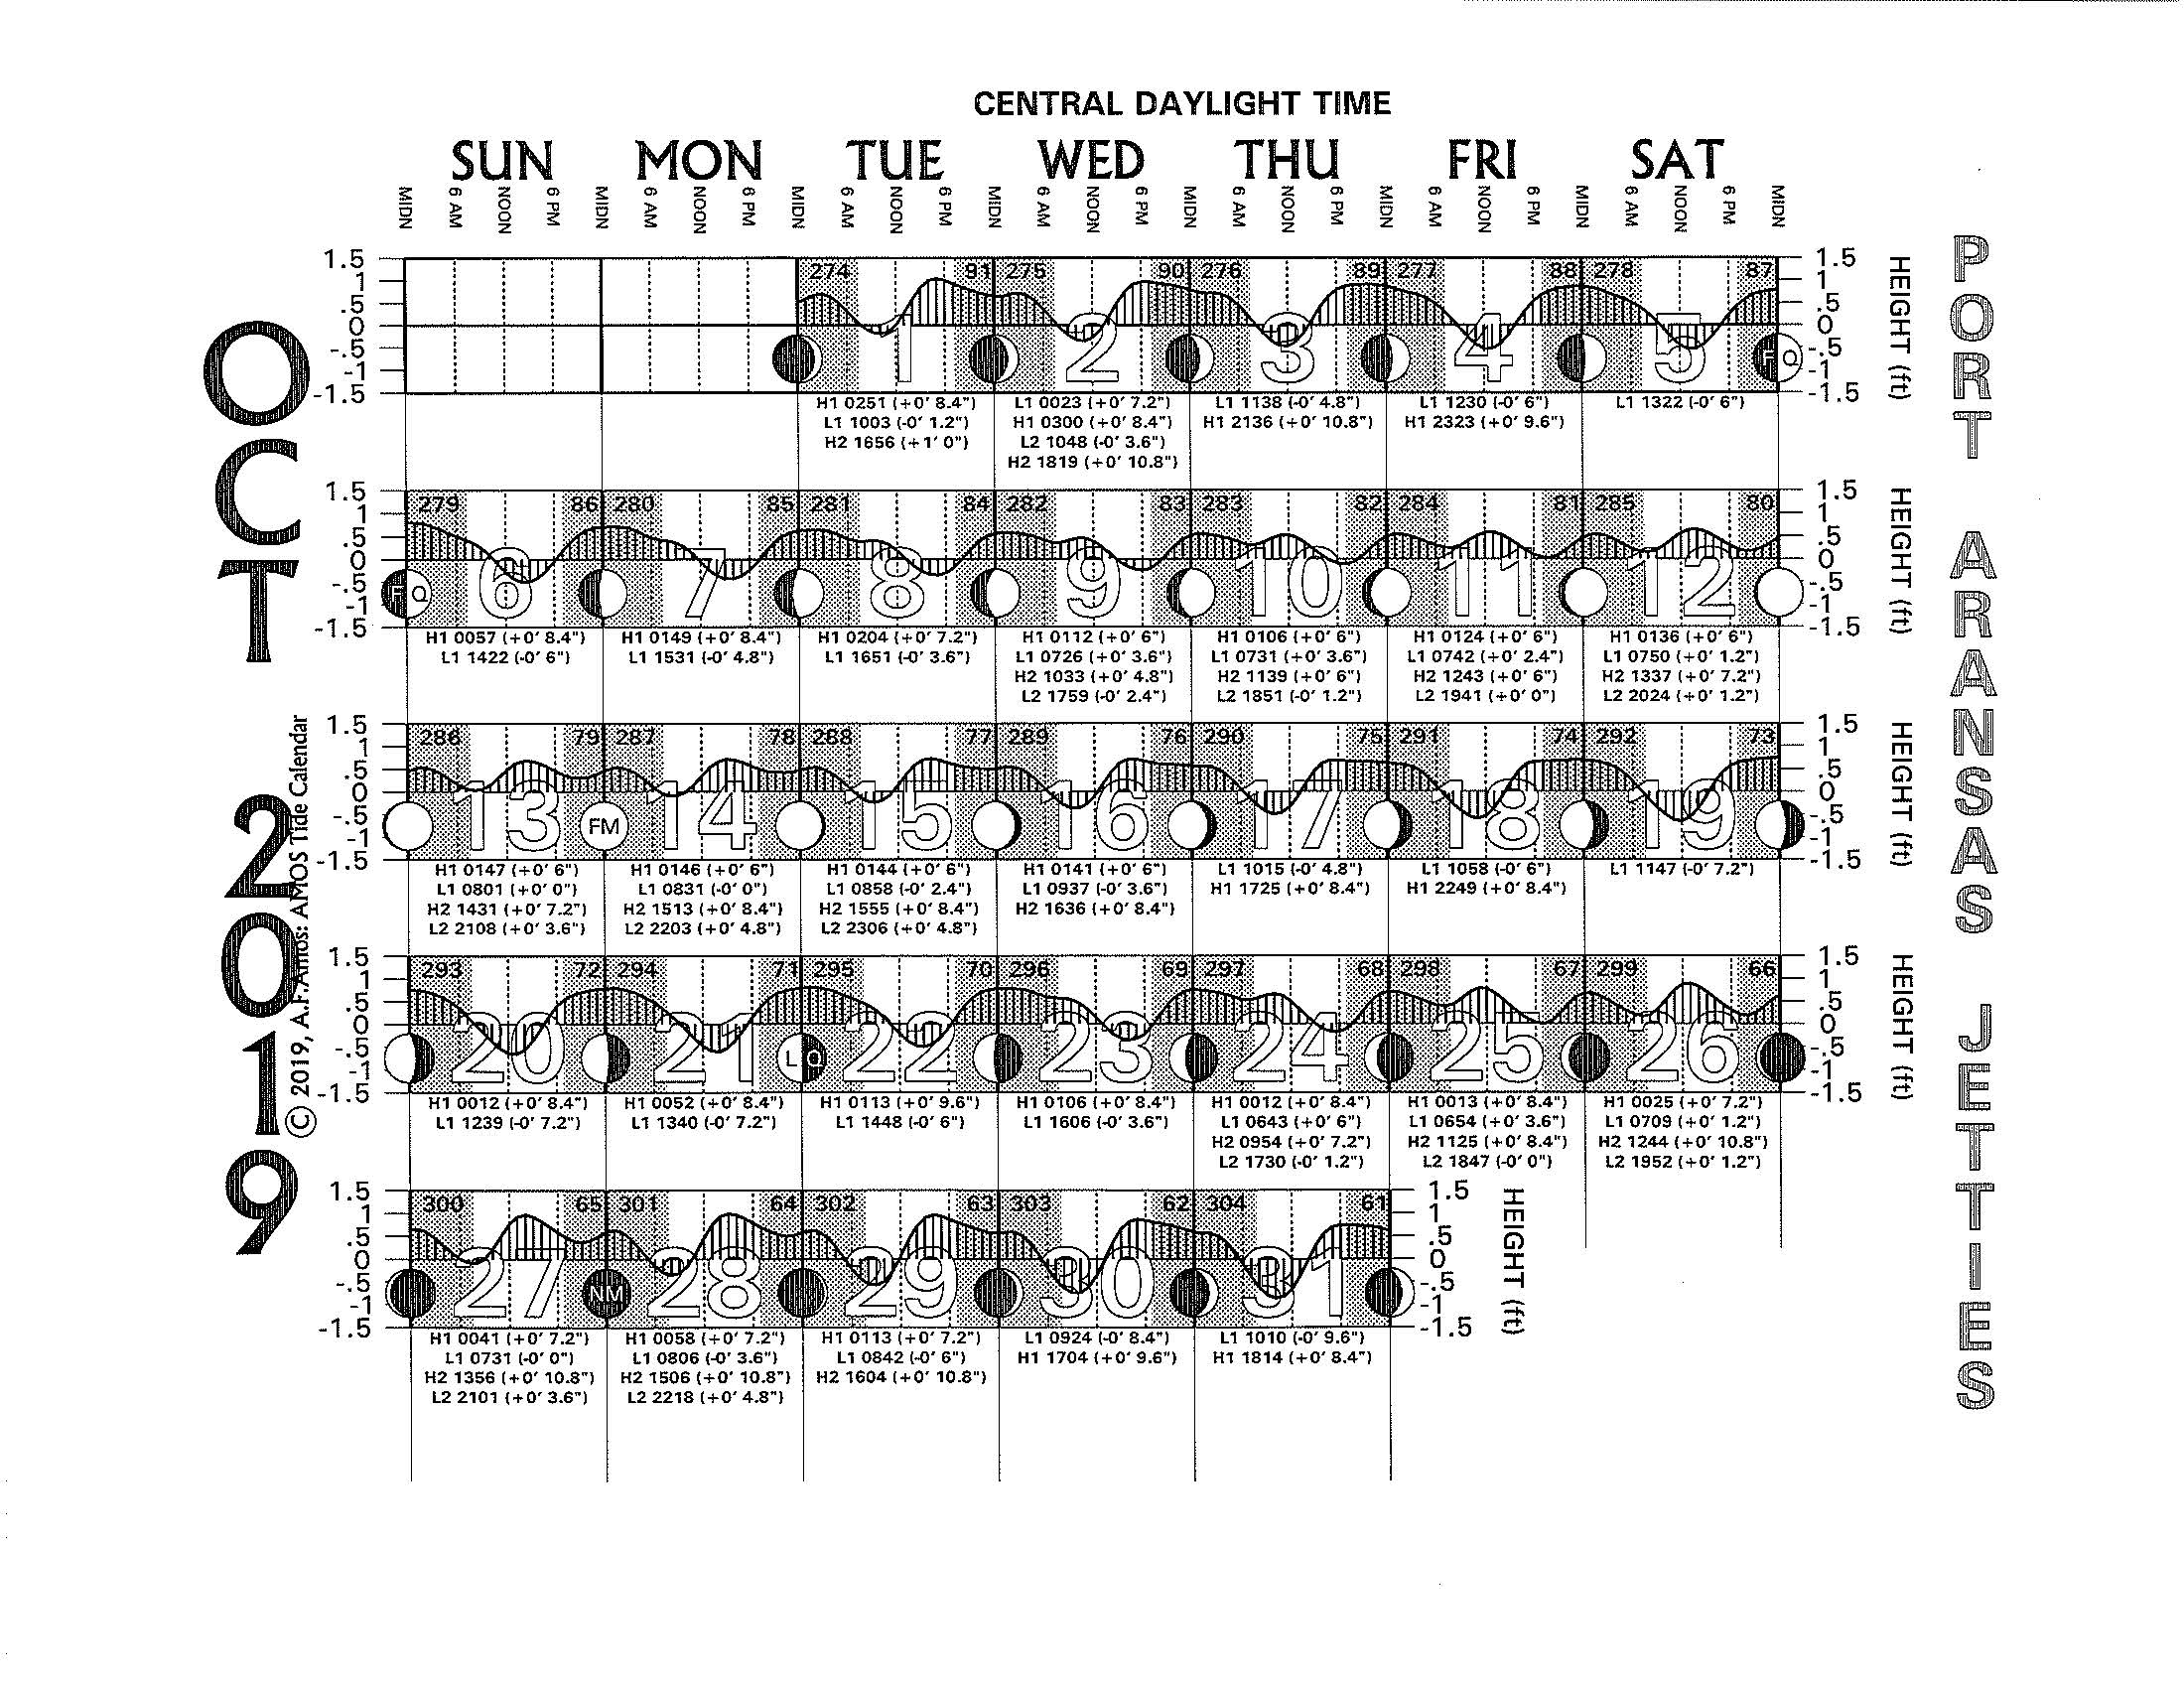
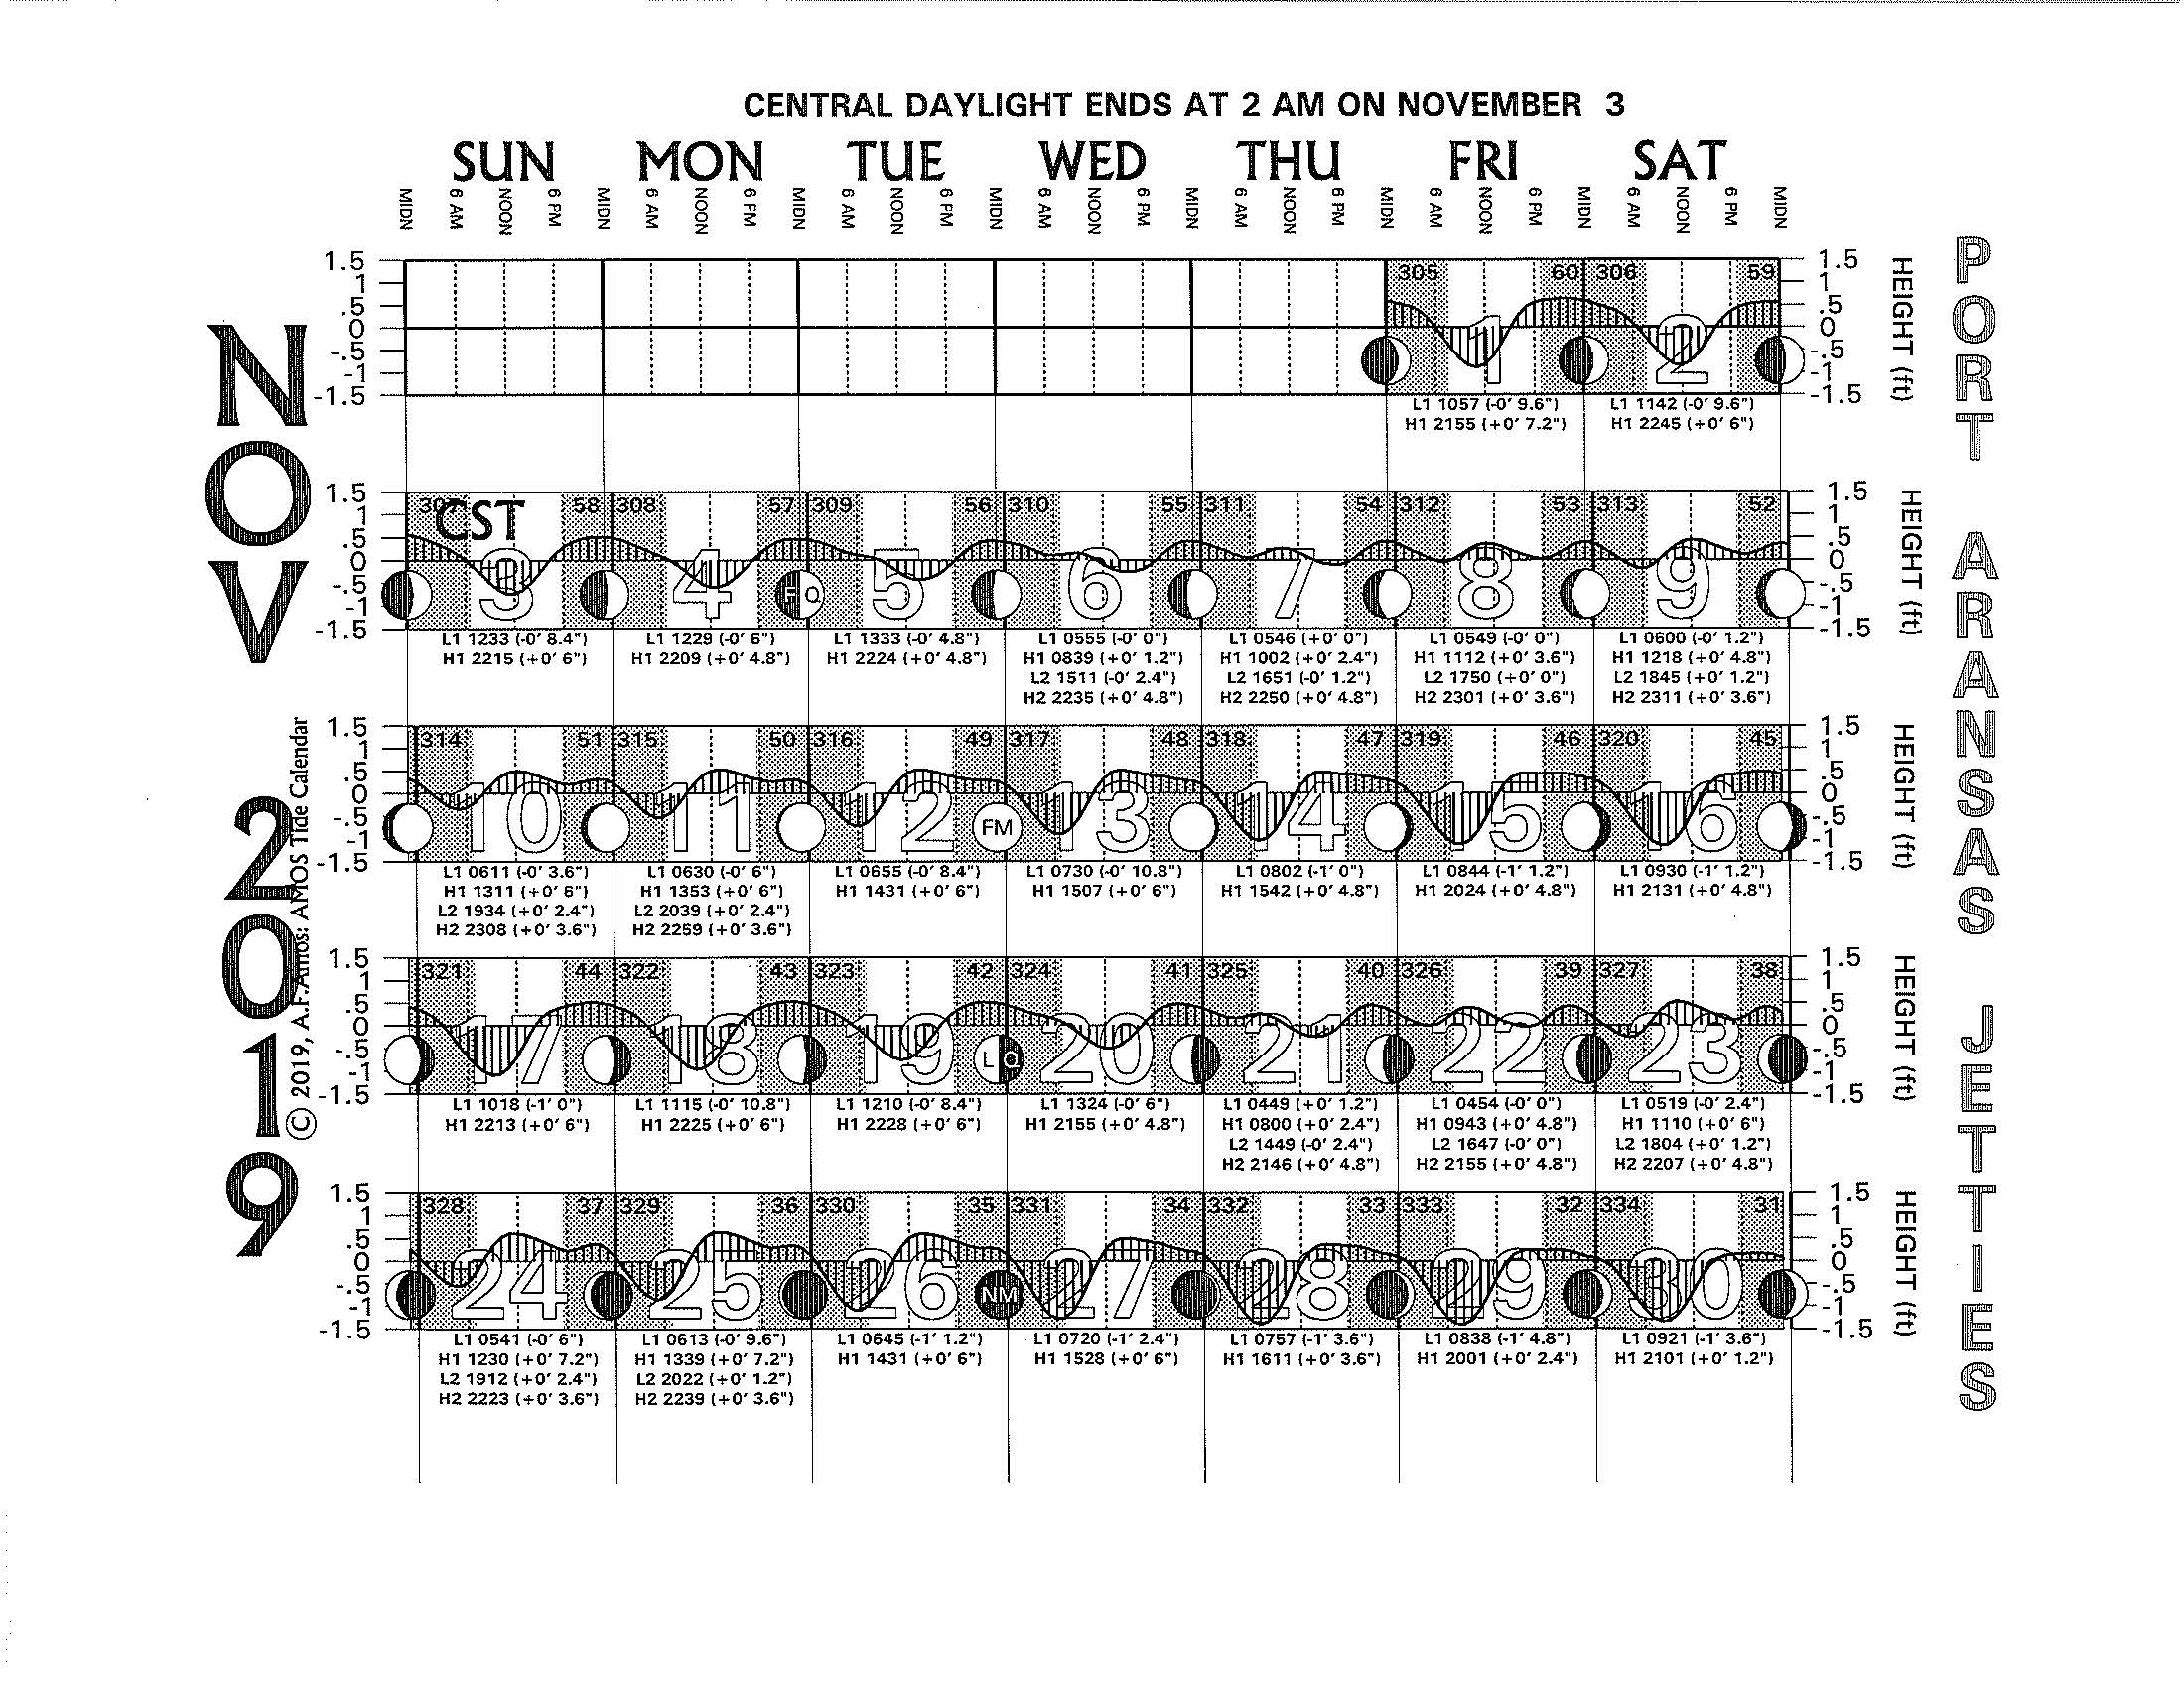
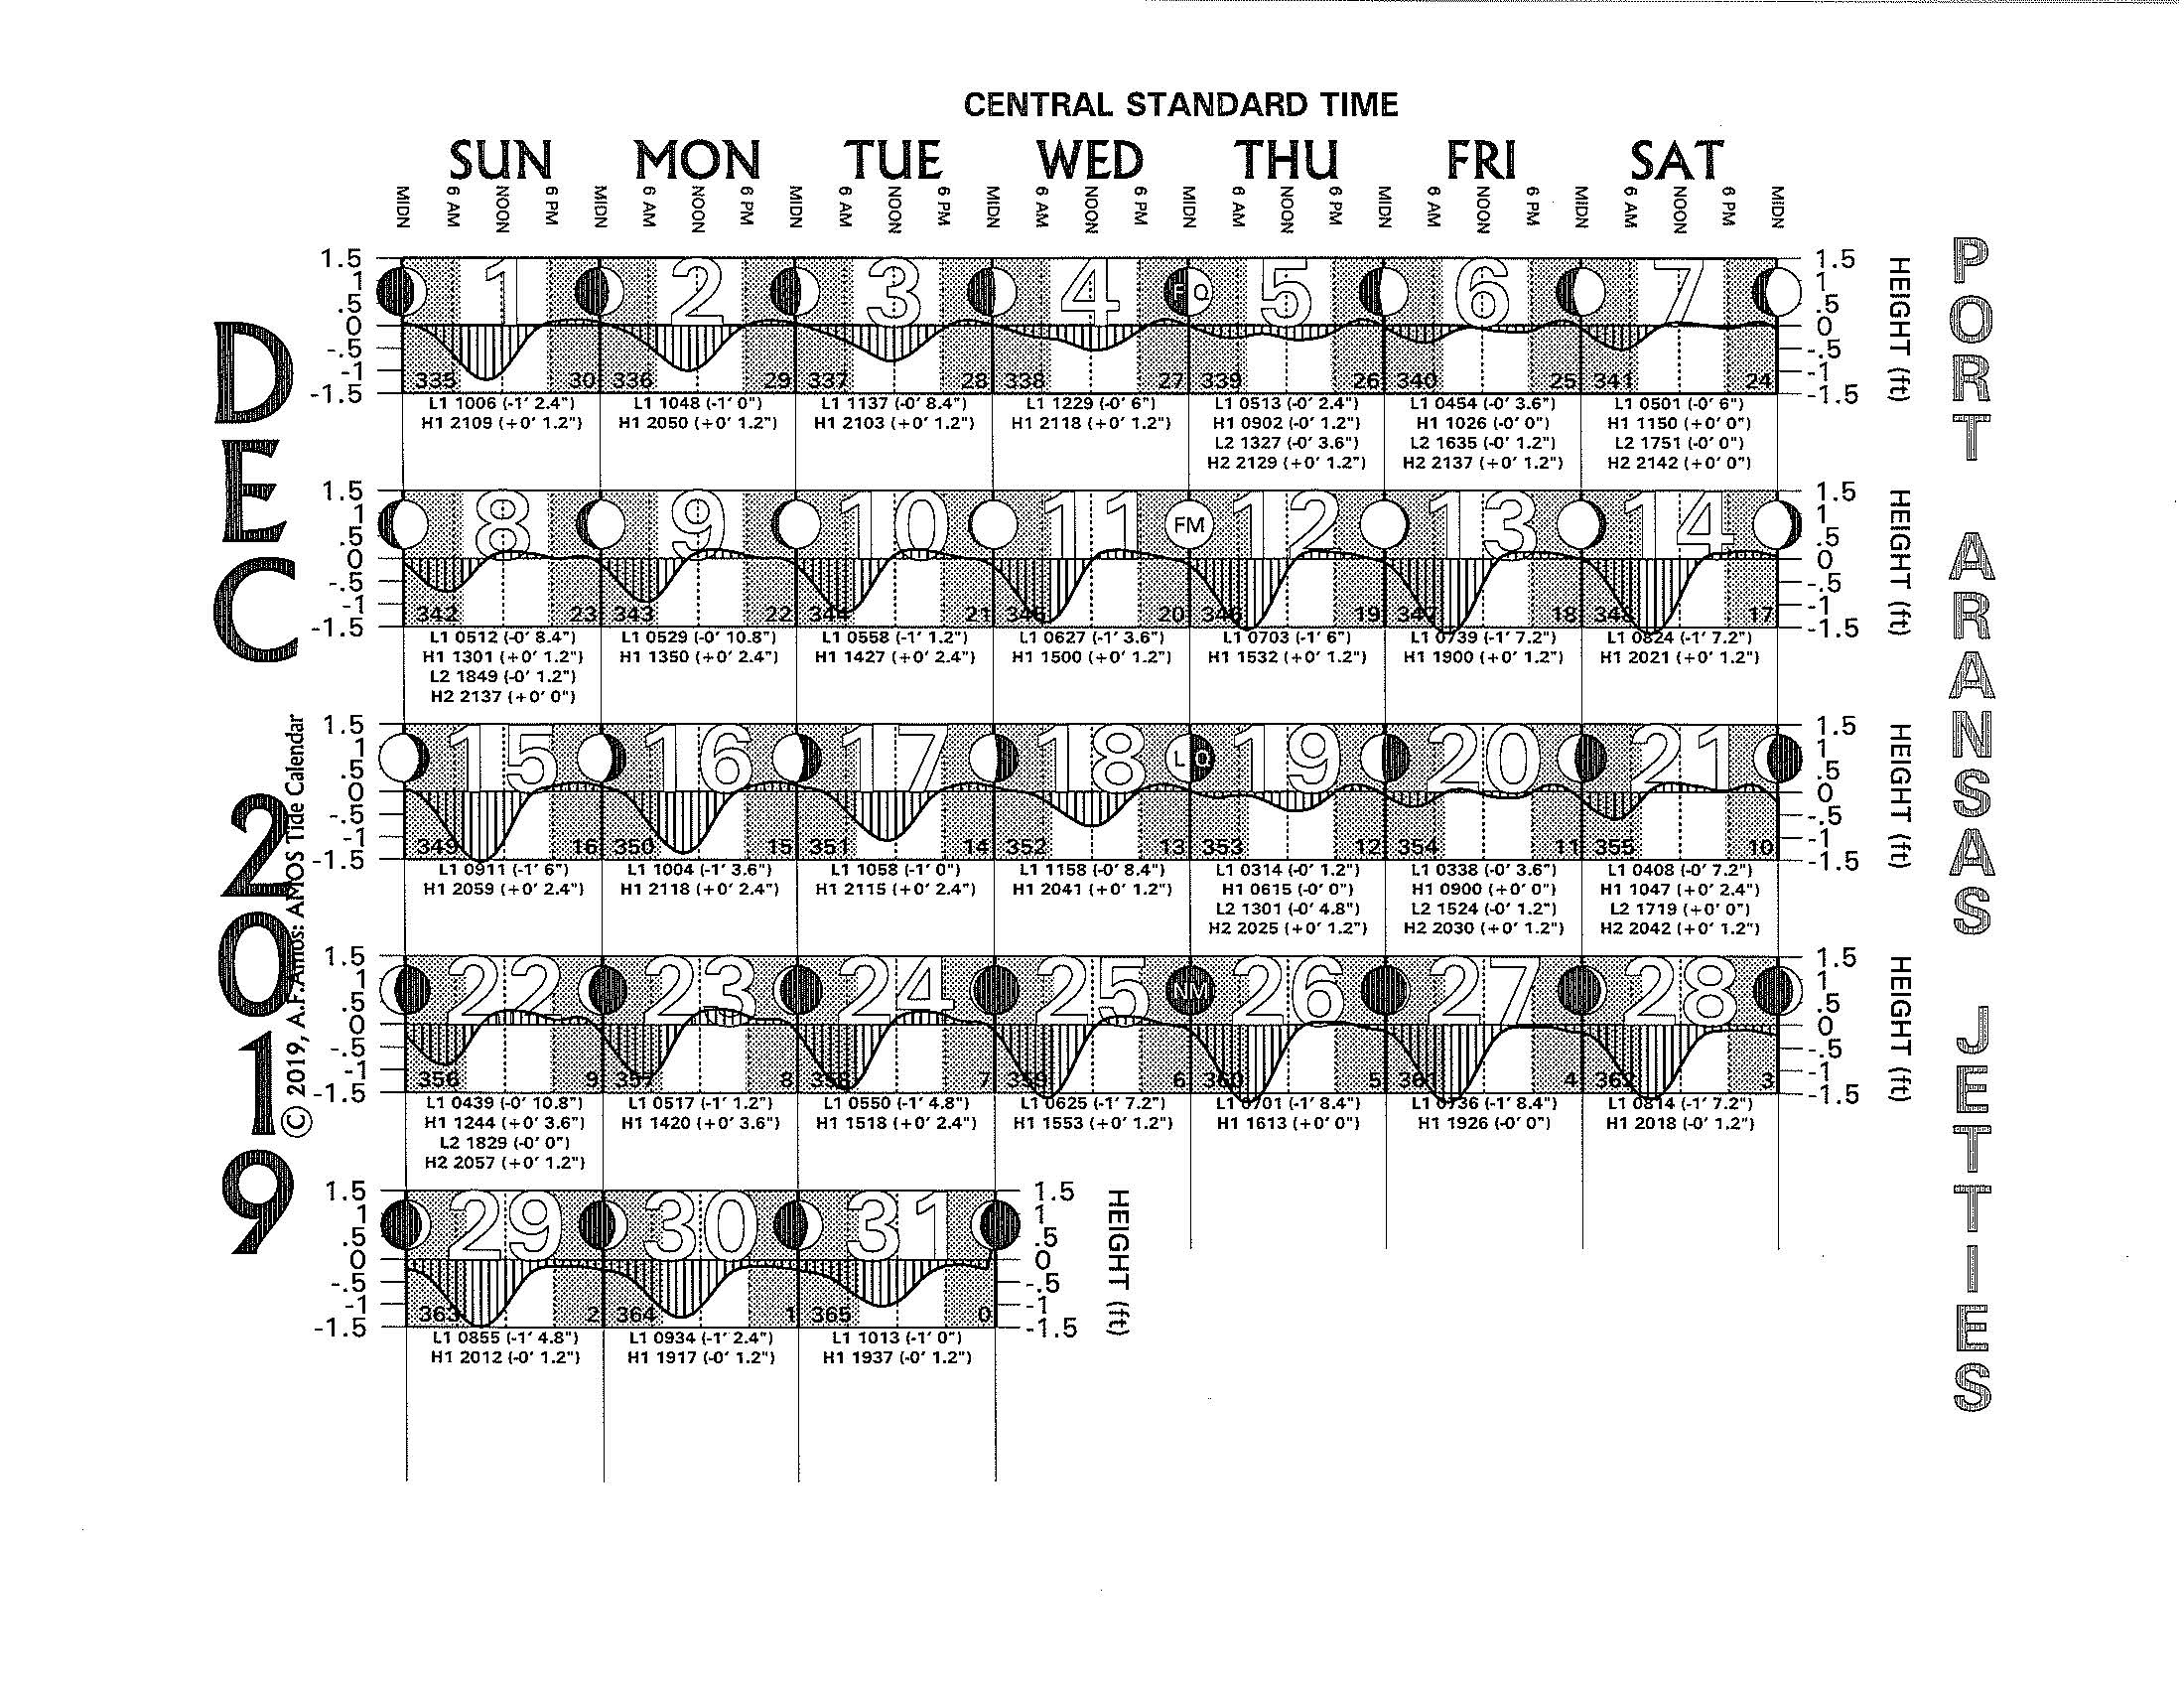
2019 Tide Charts - Texas Tides: Port Aransas Jetties
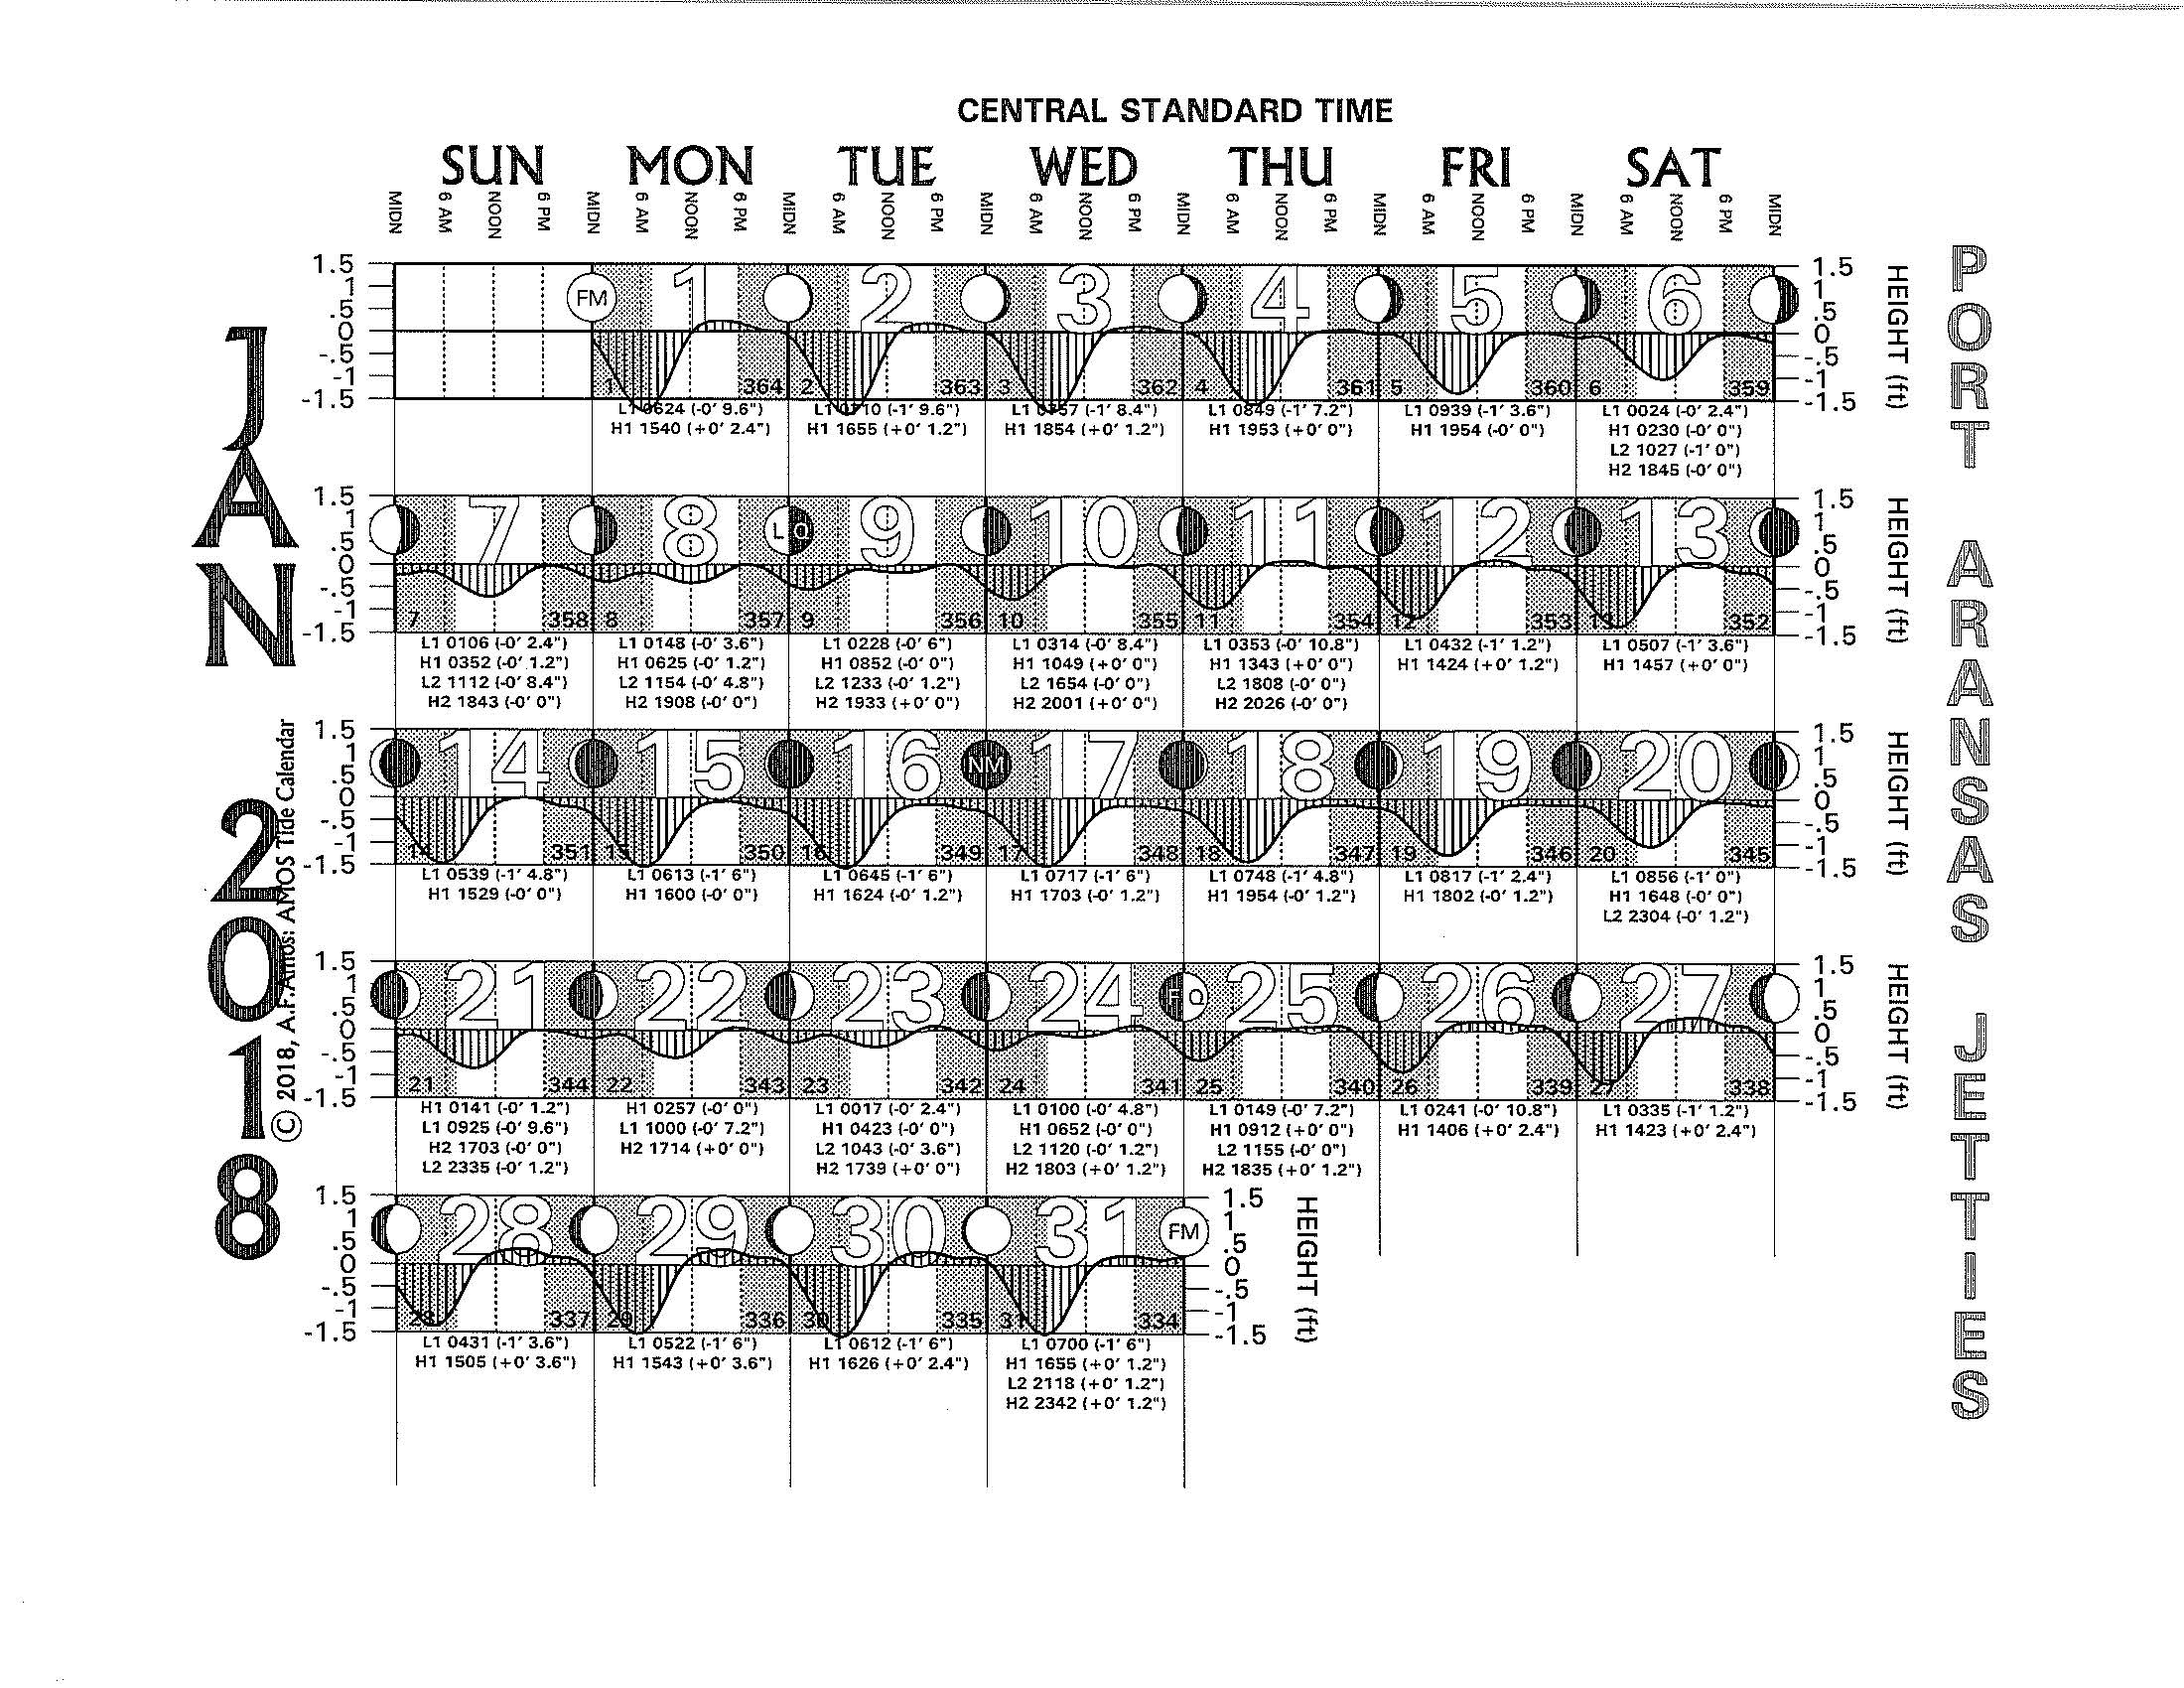
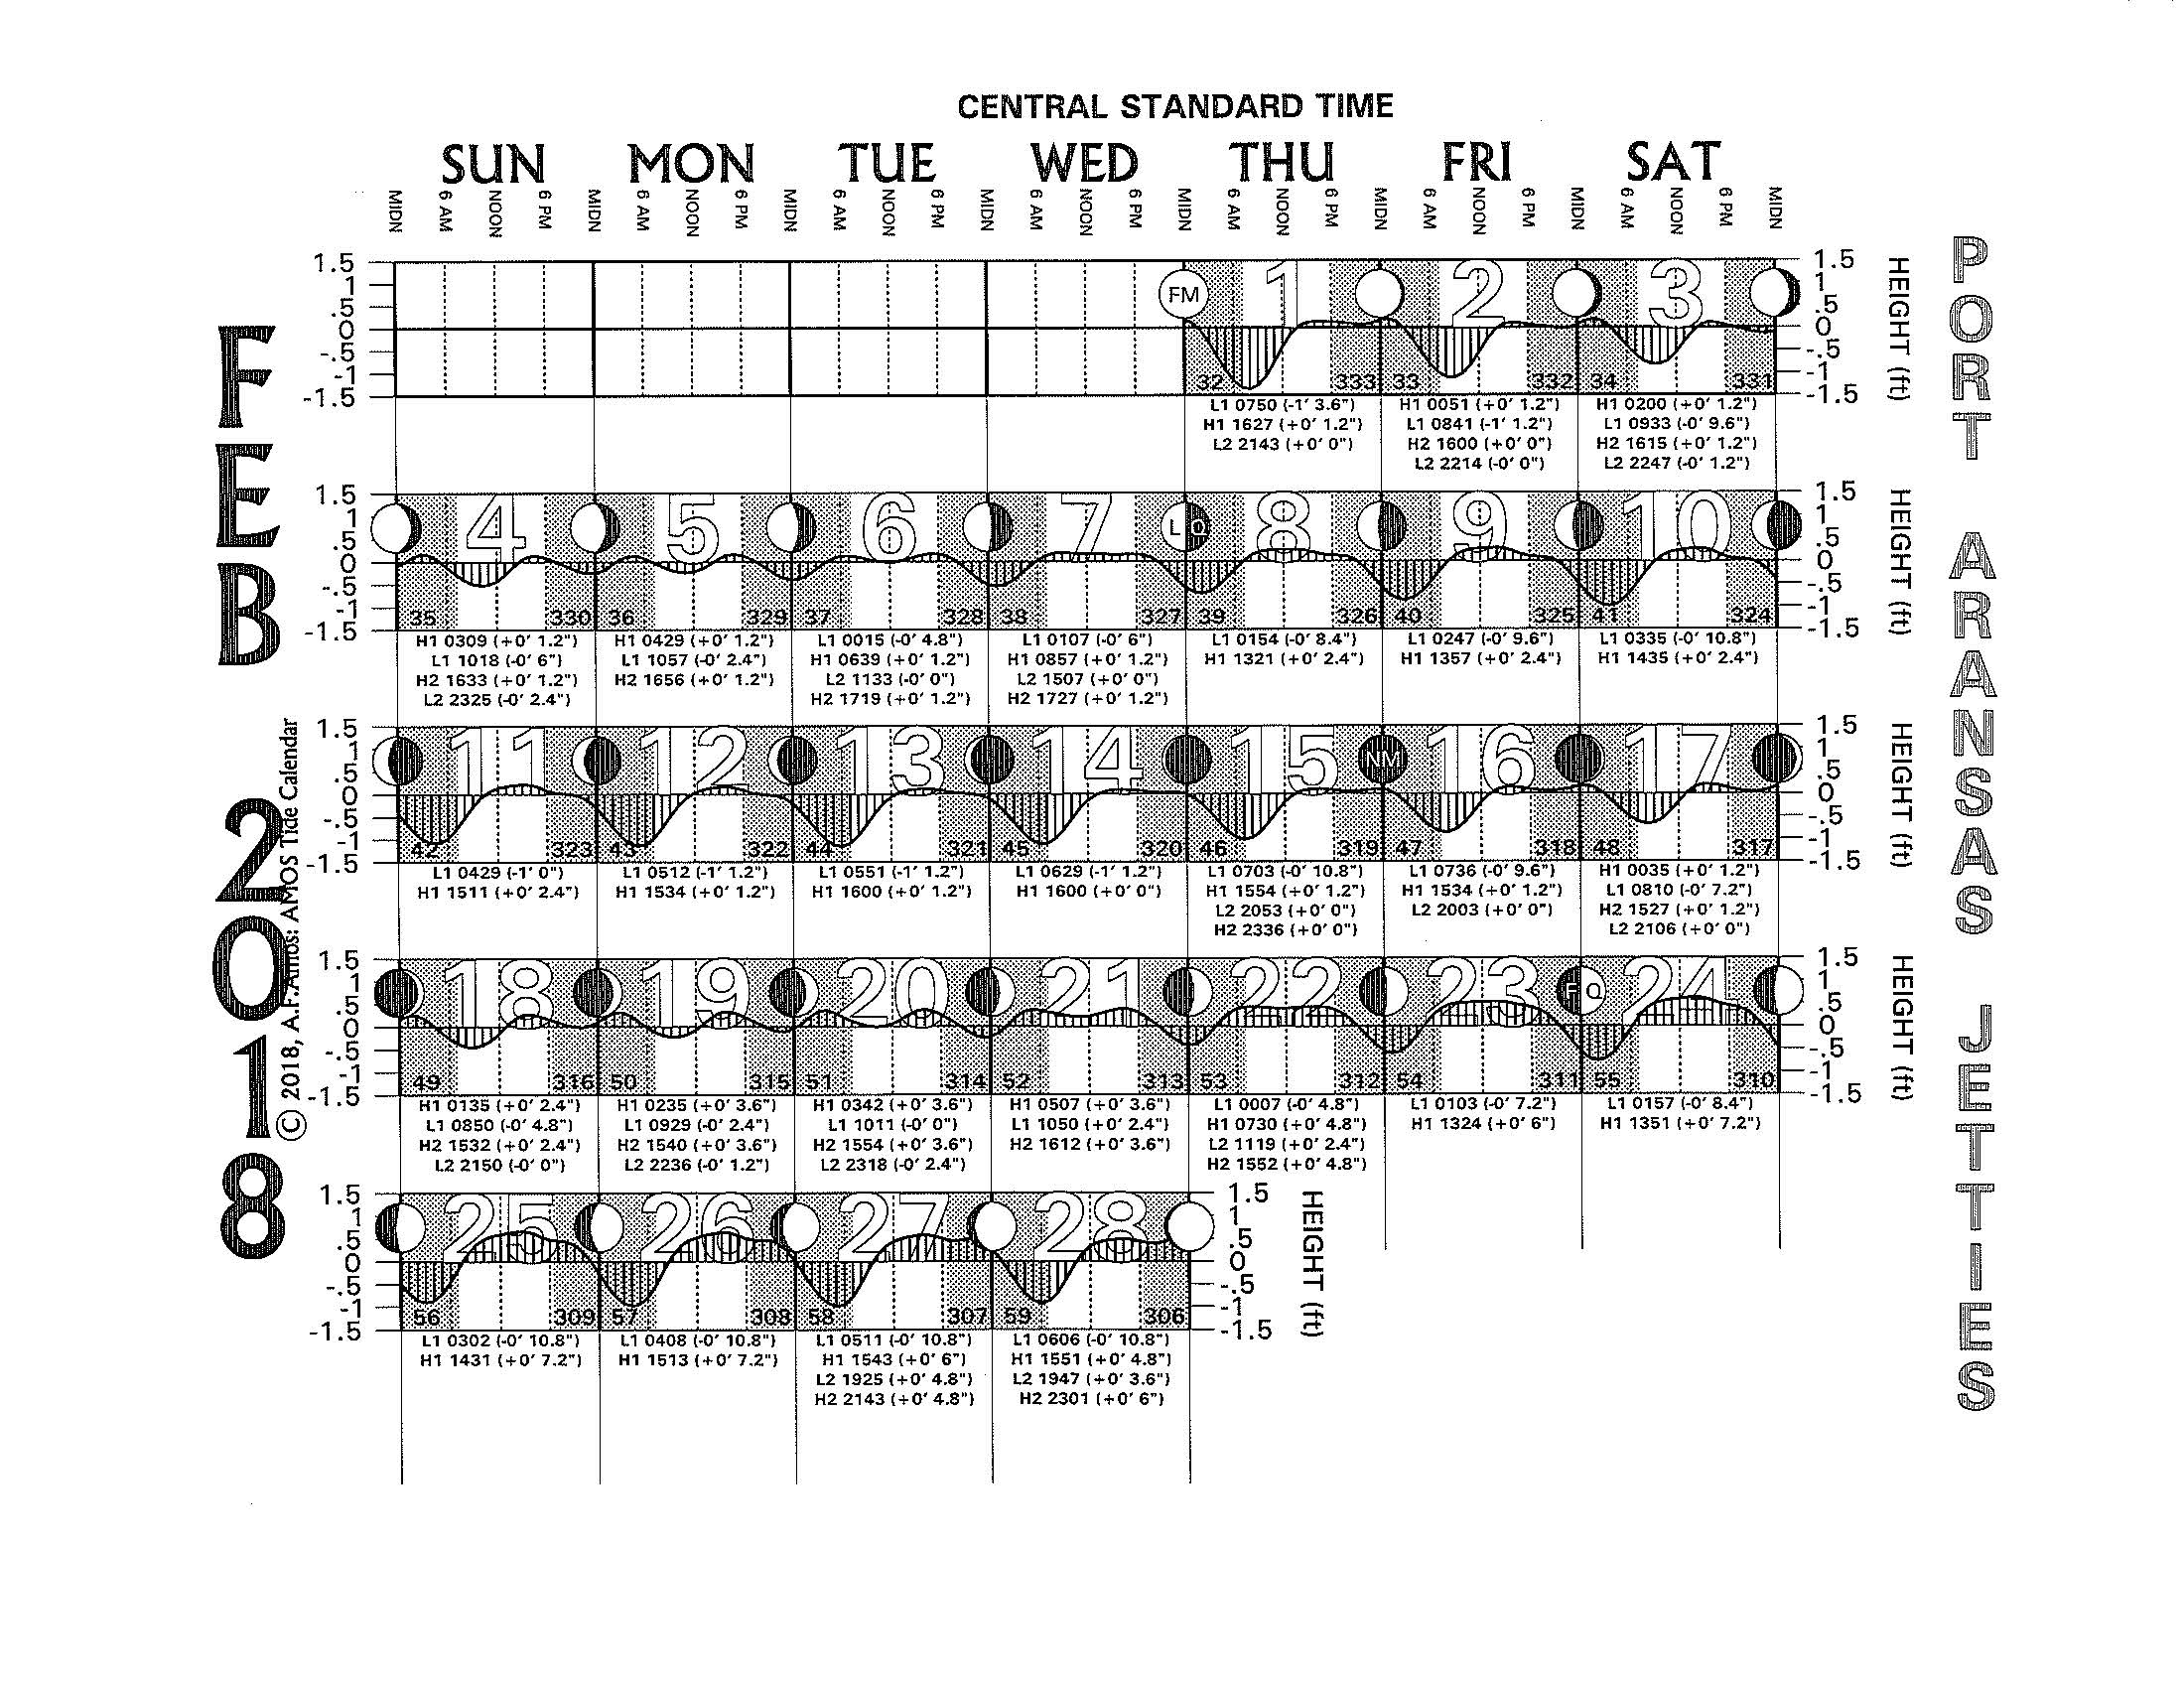
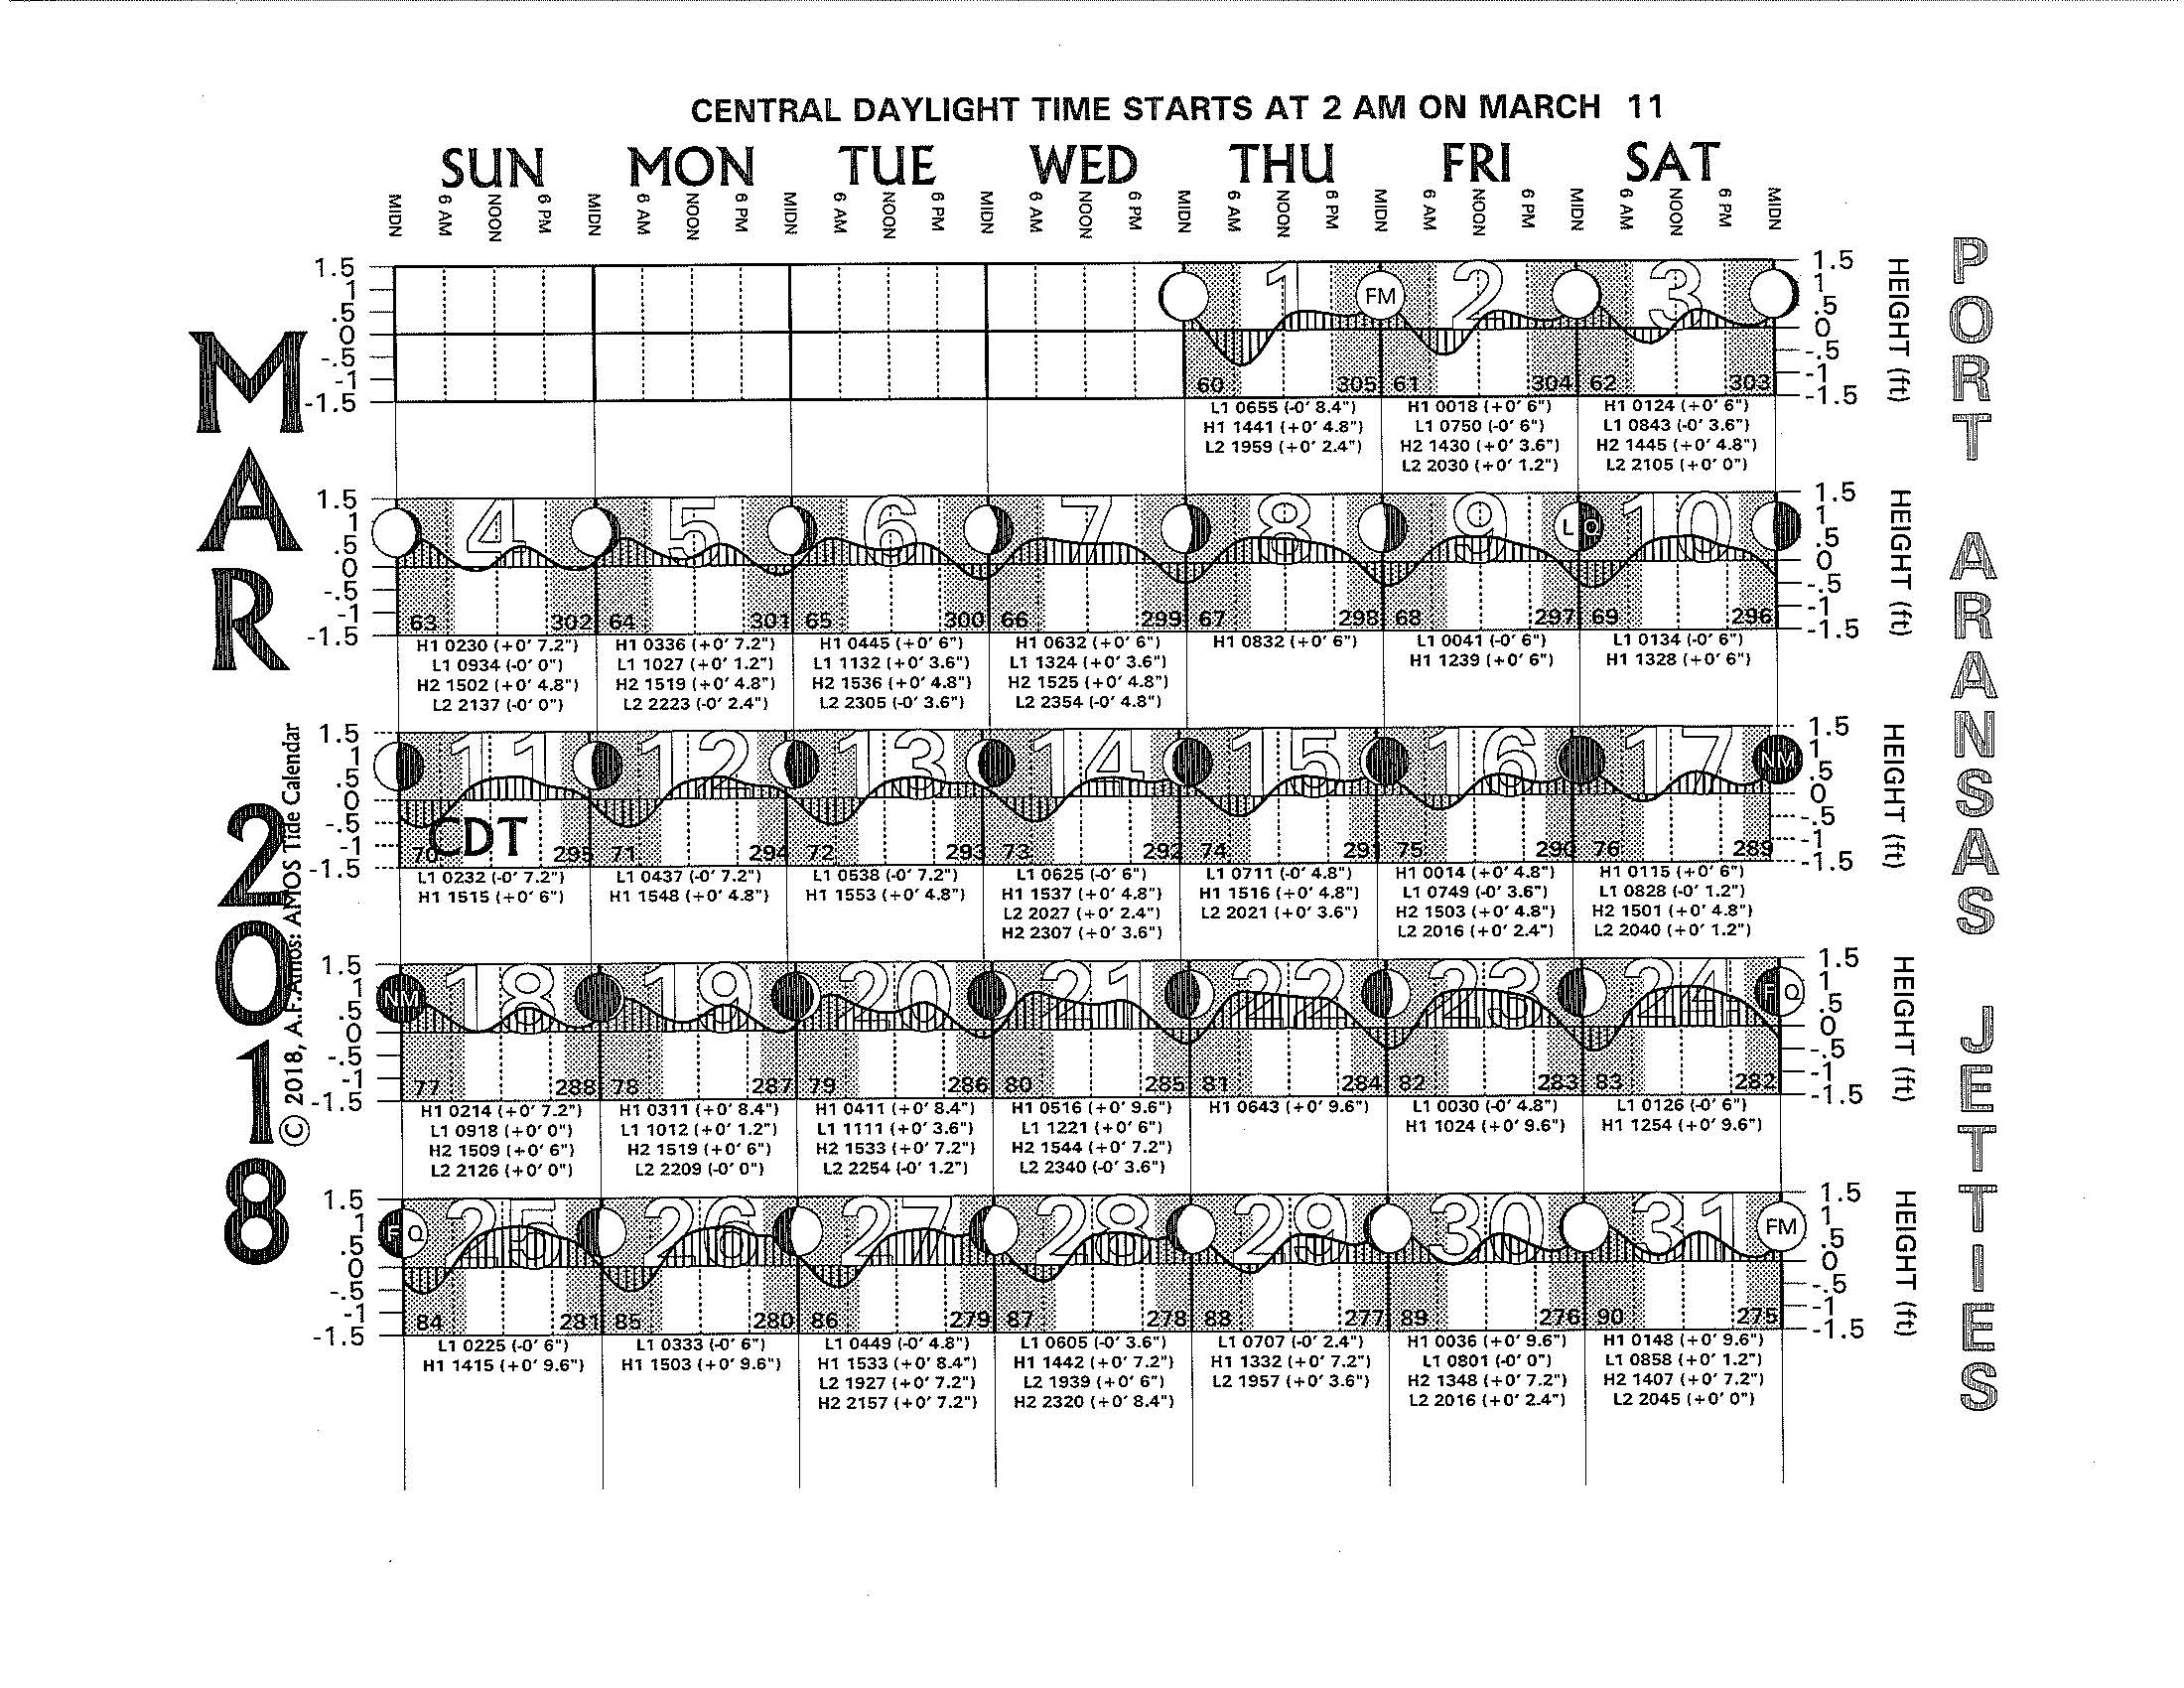
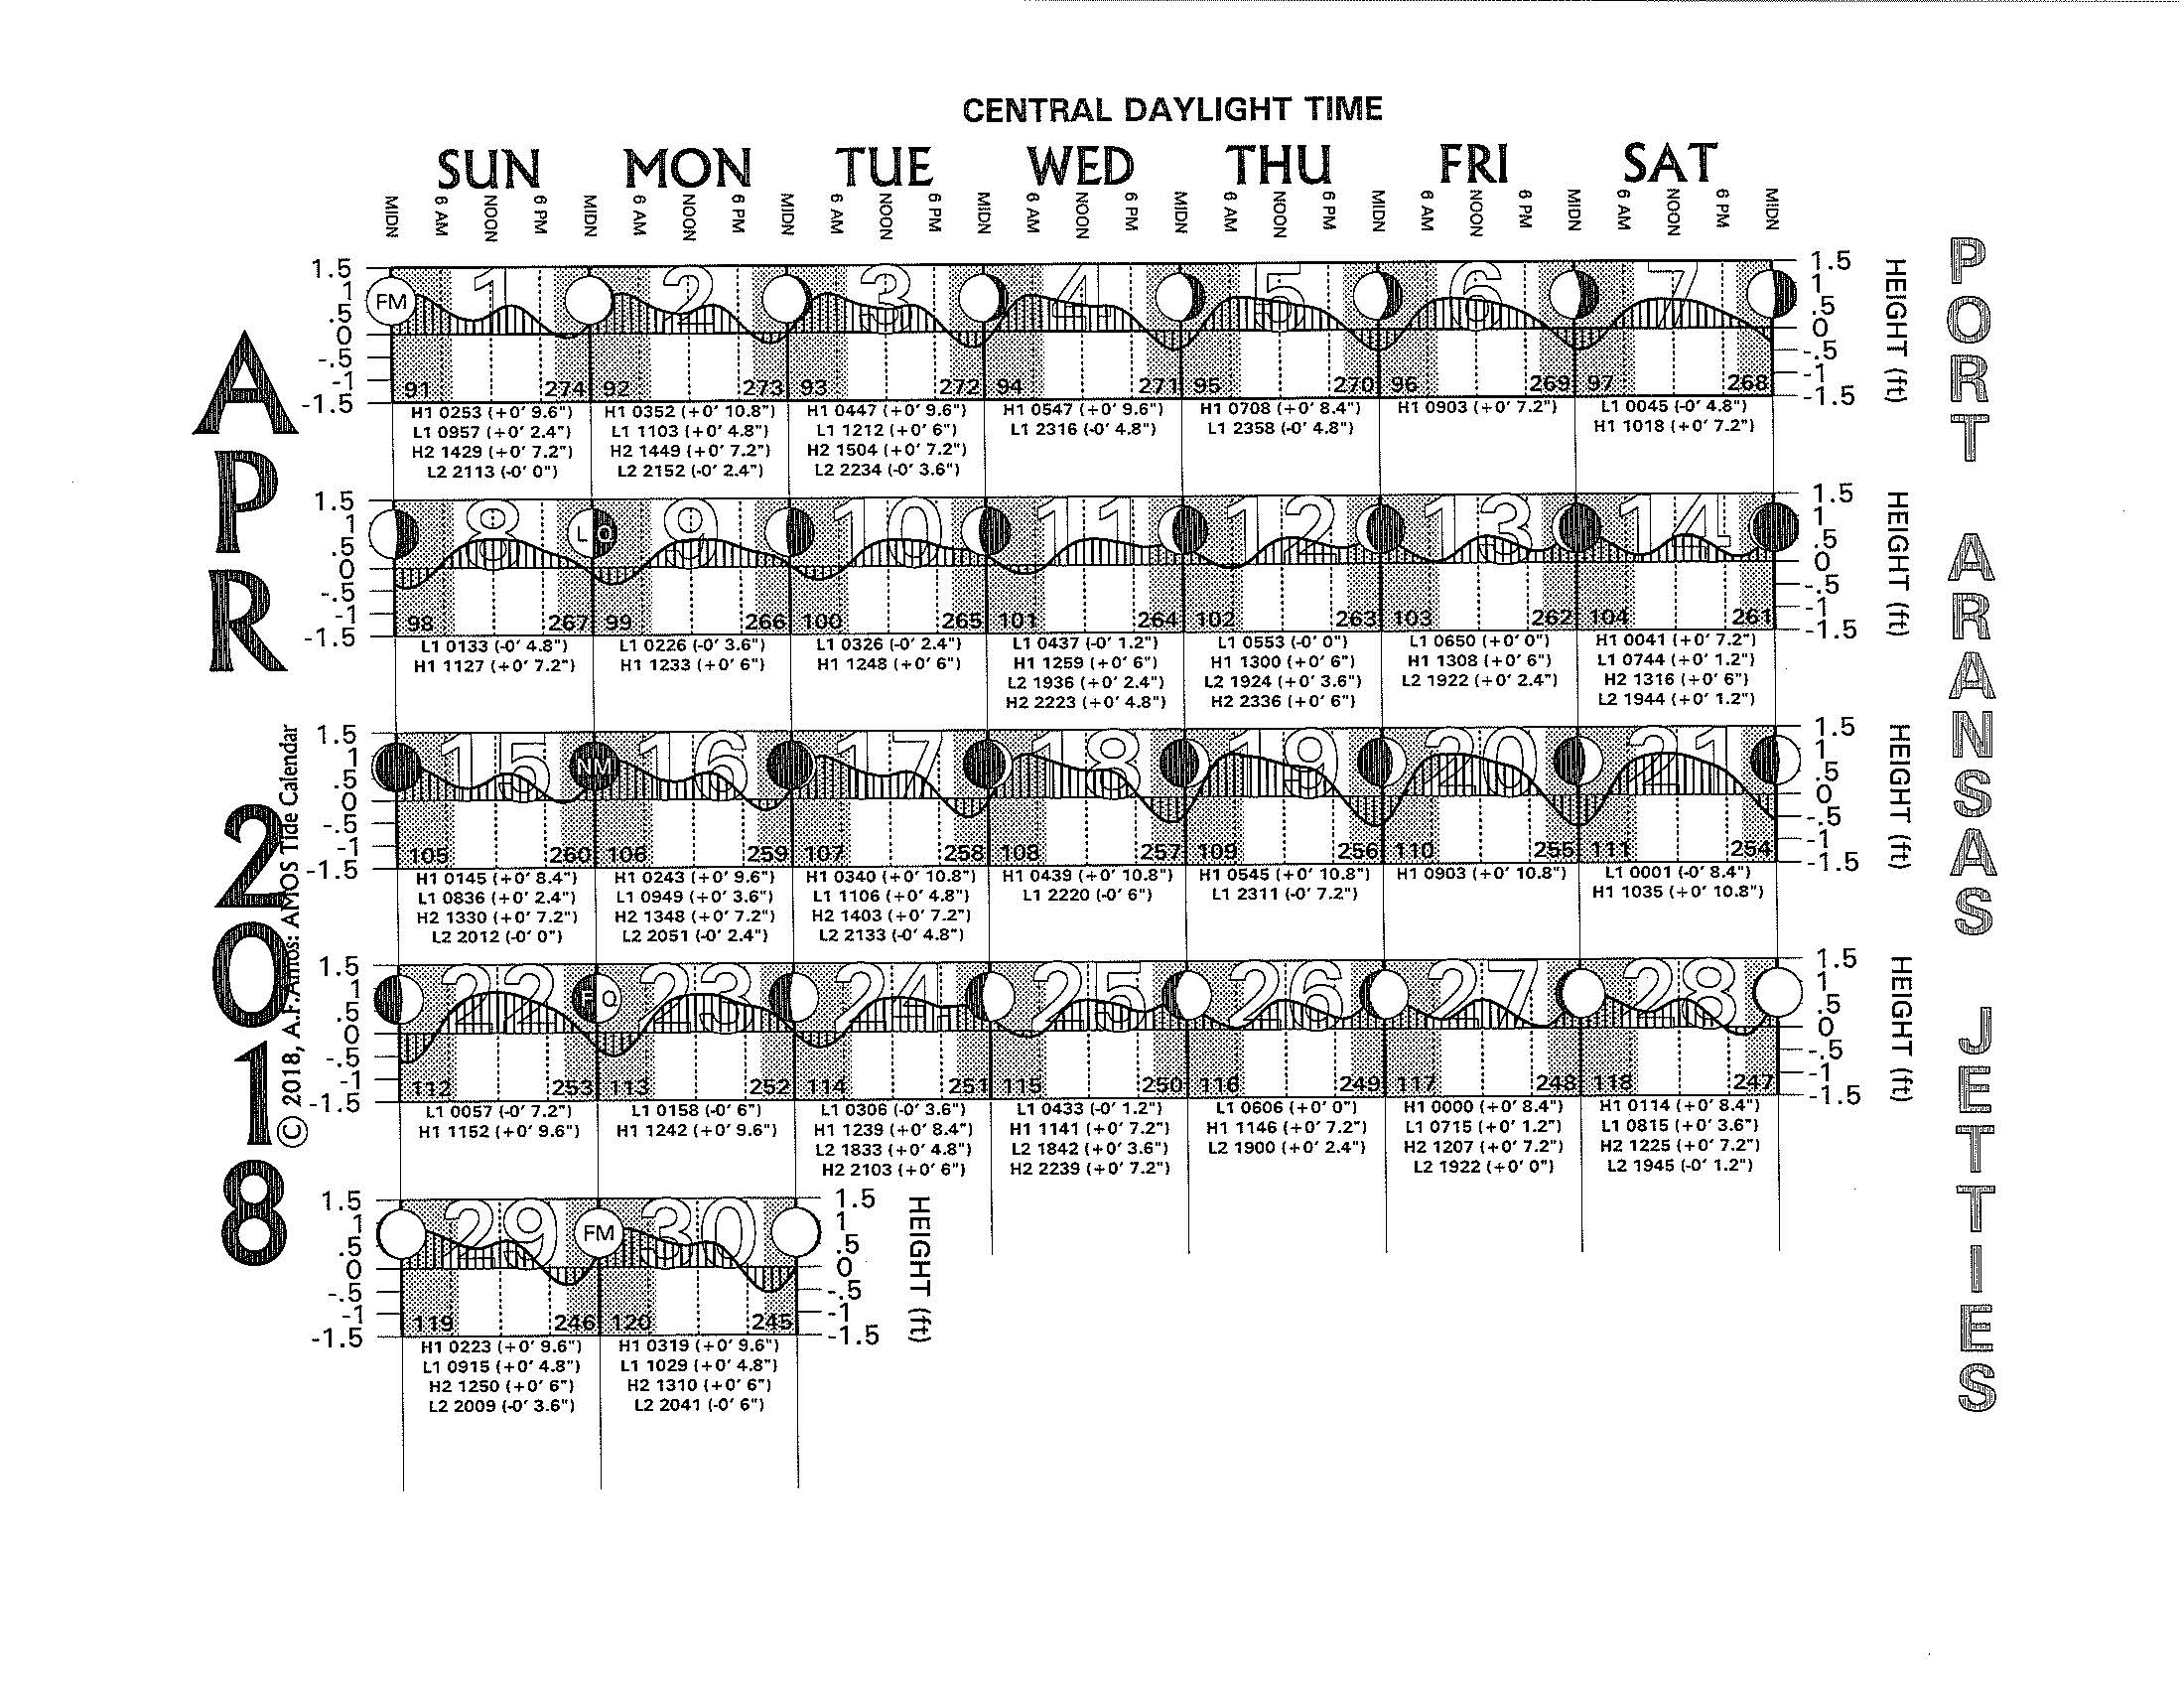
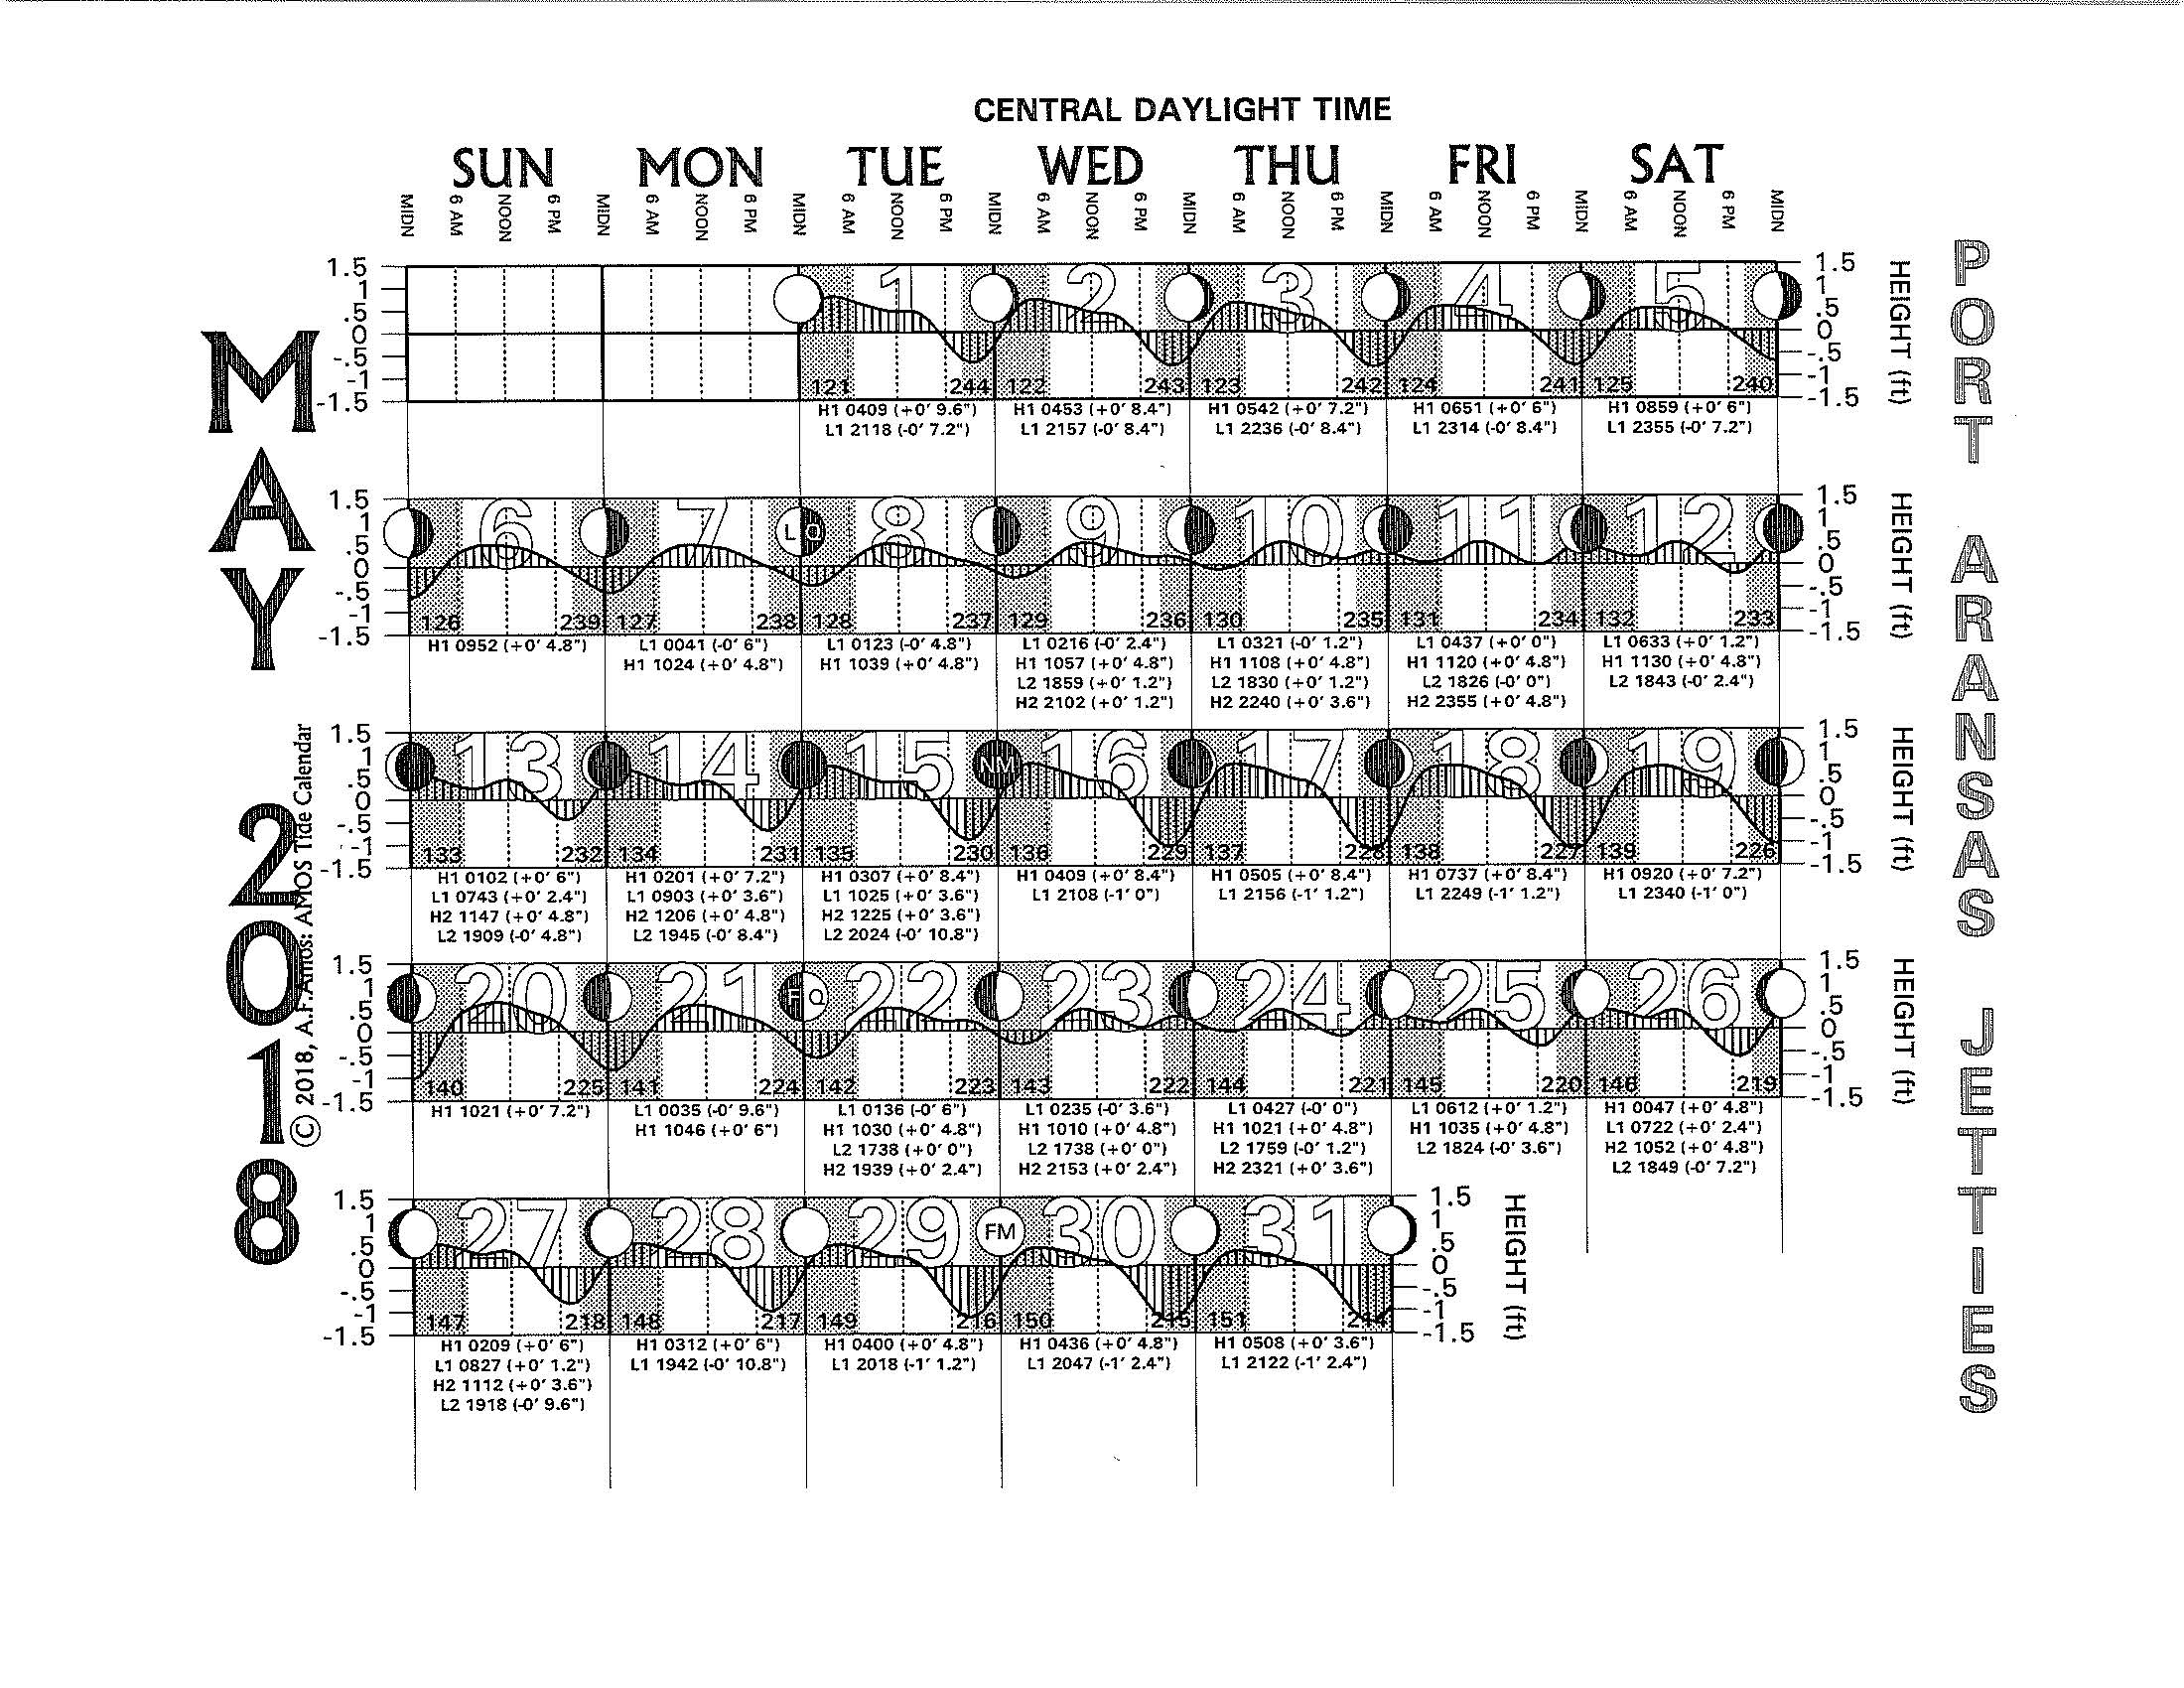
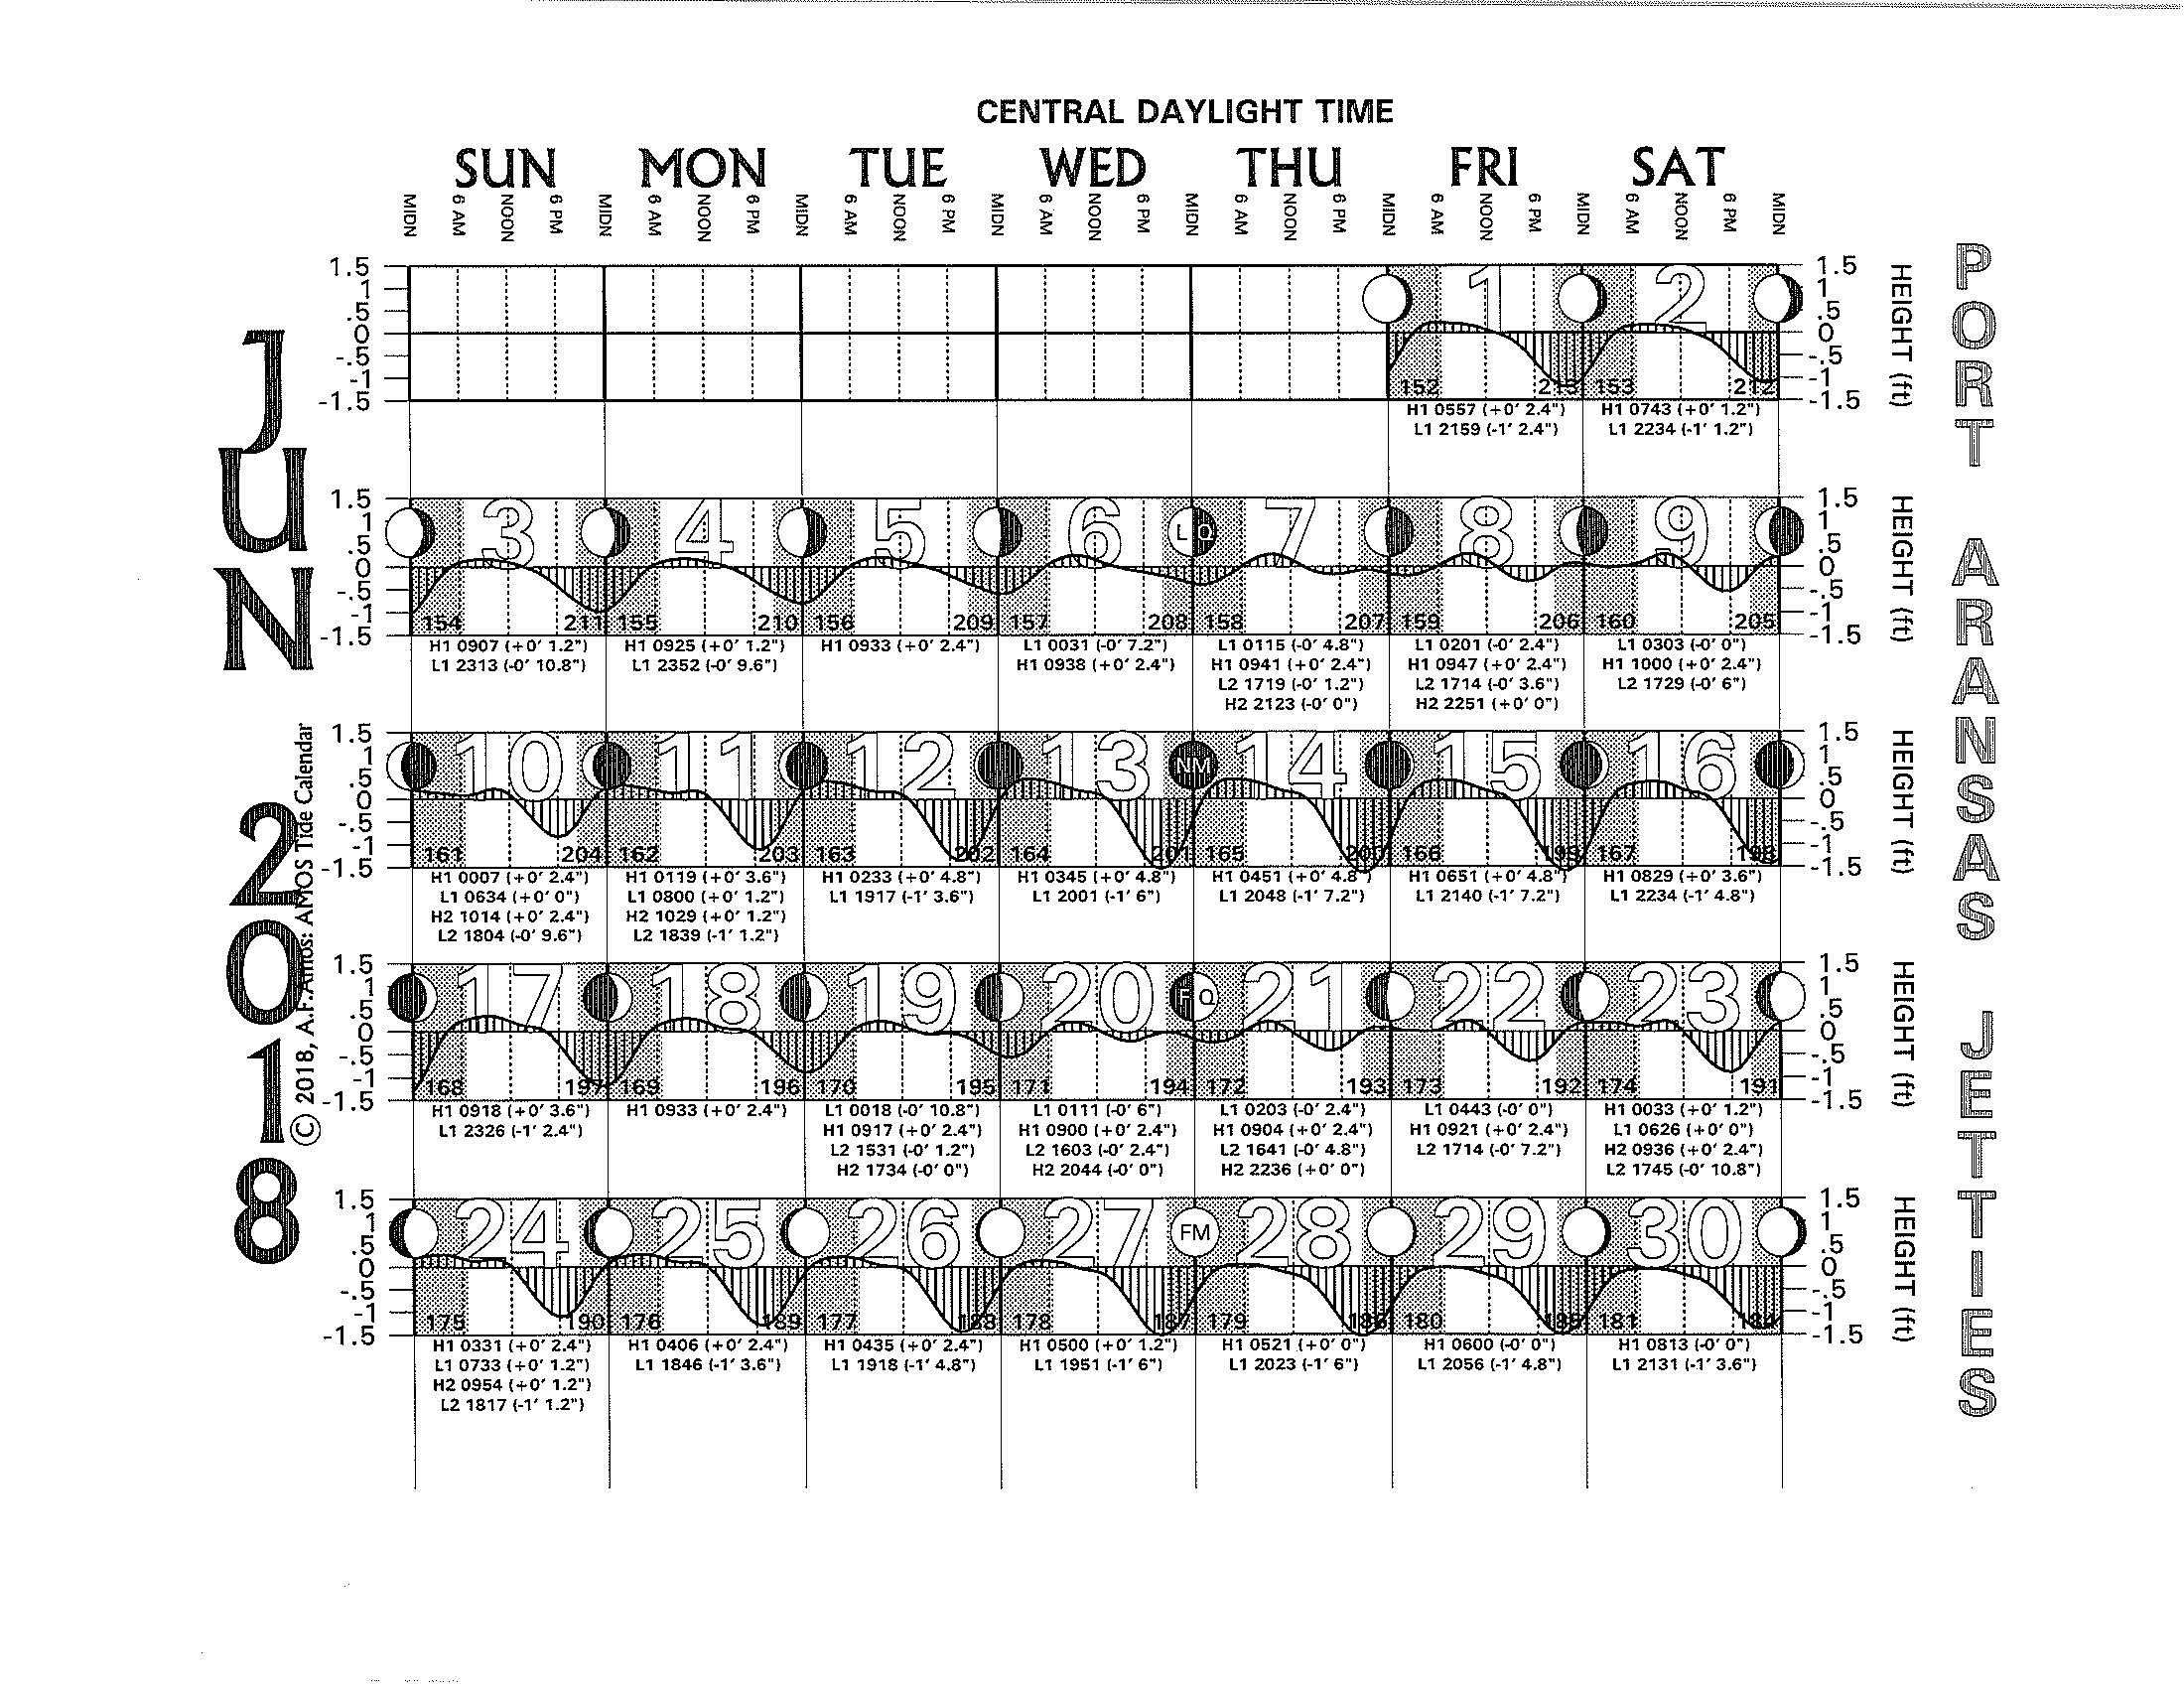
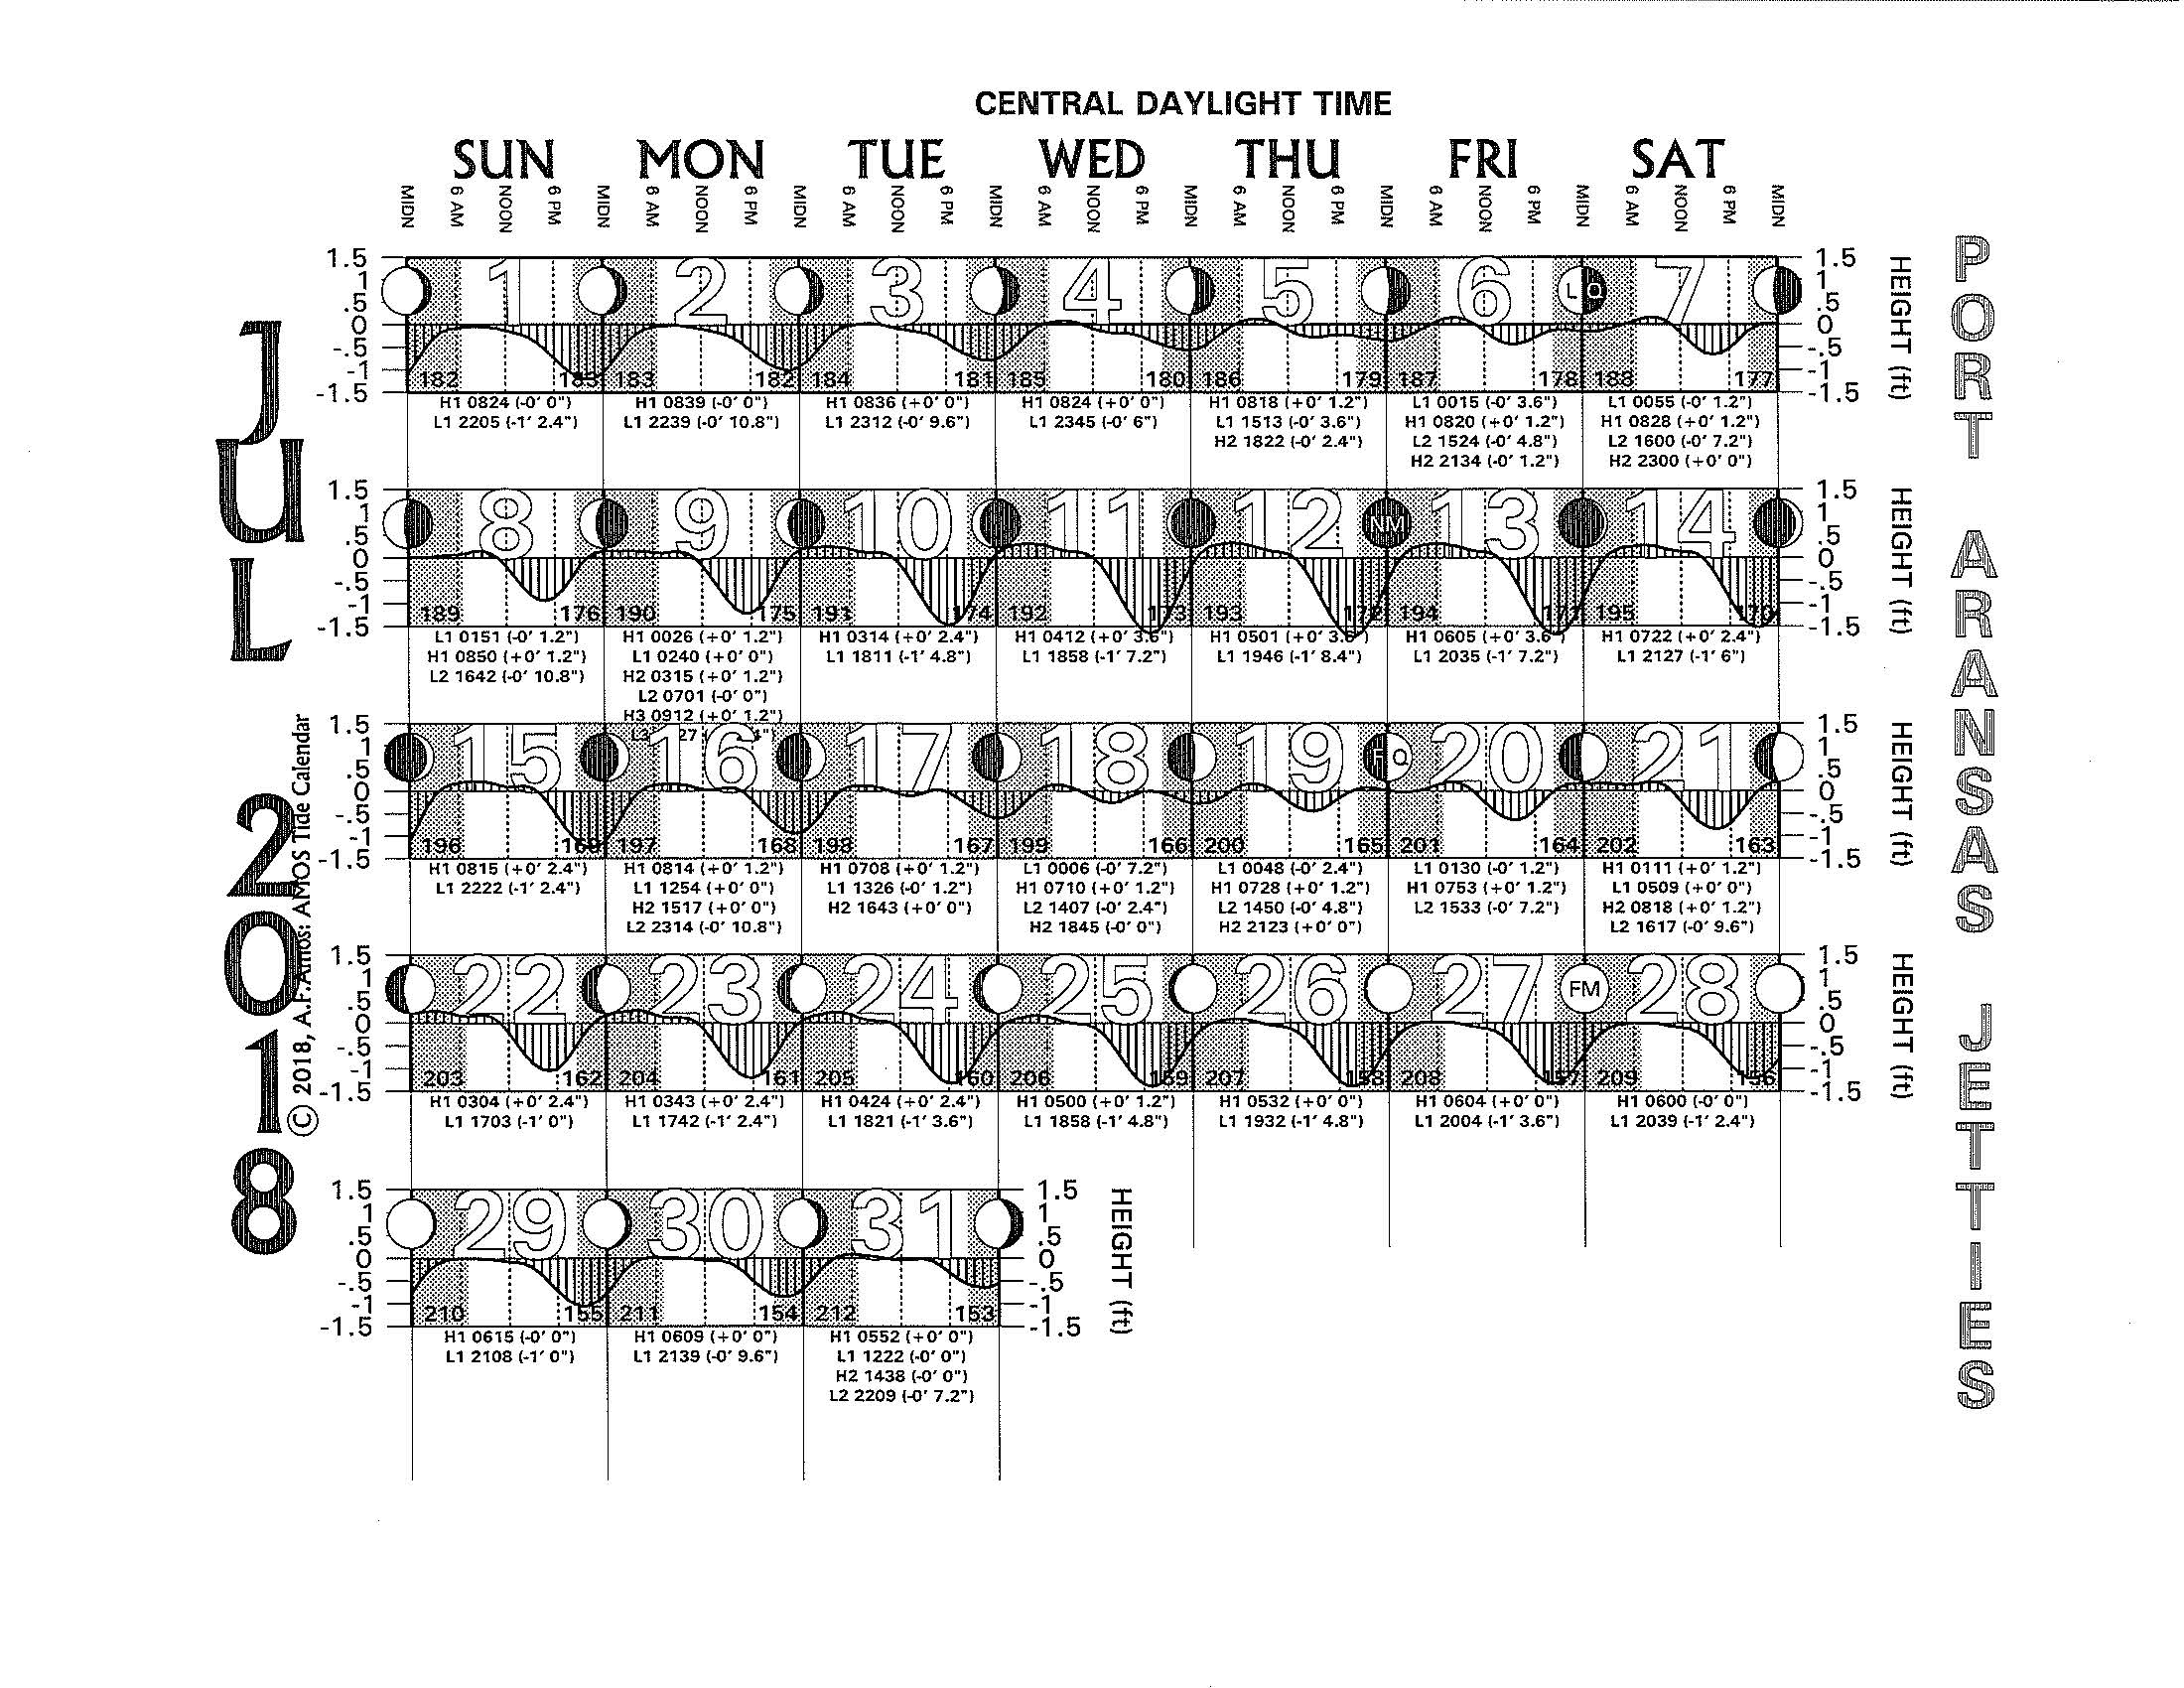
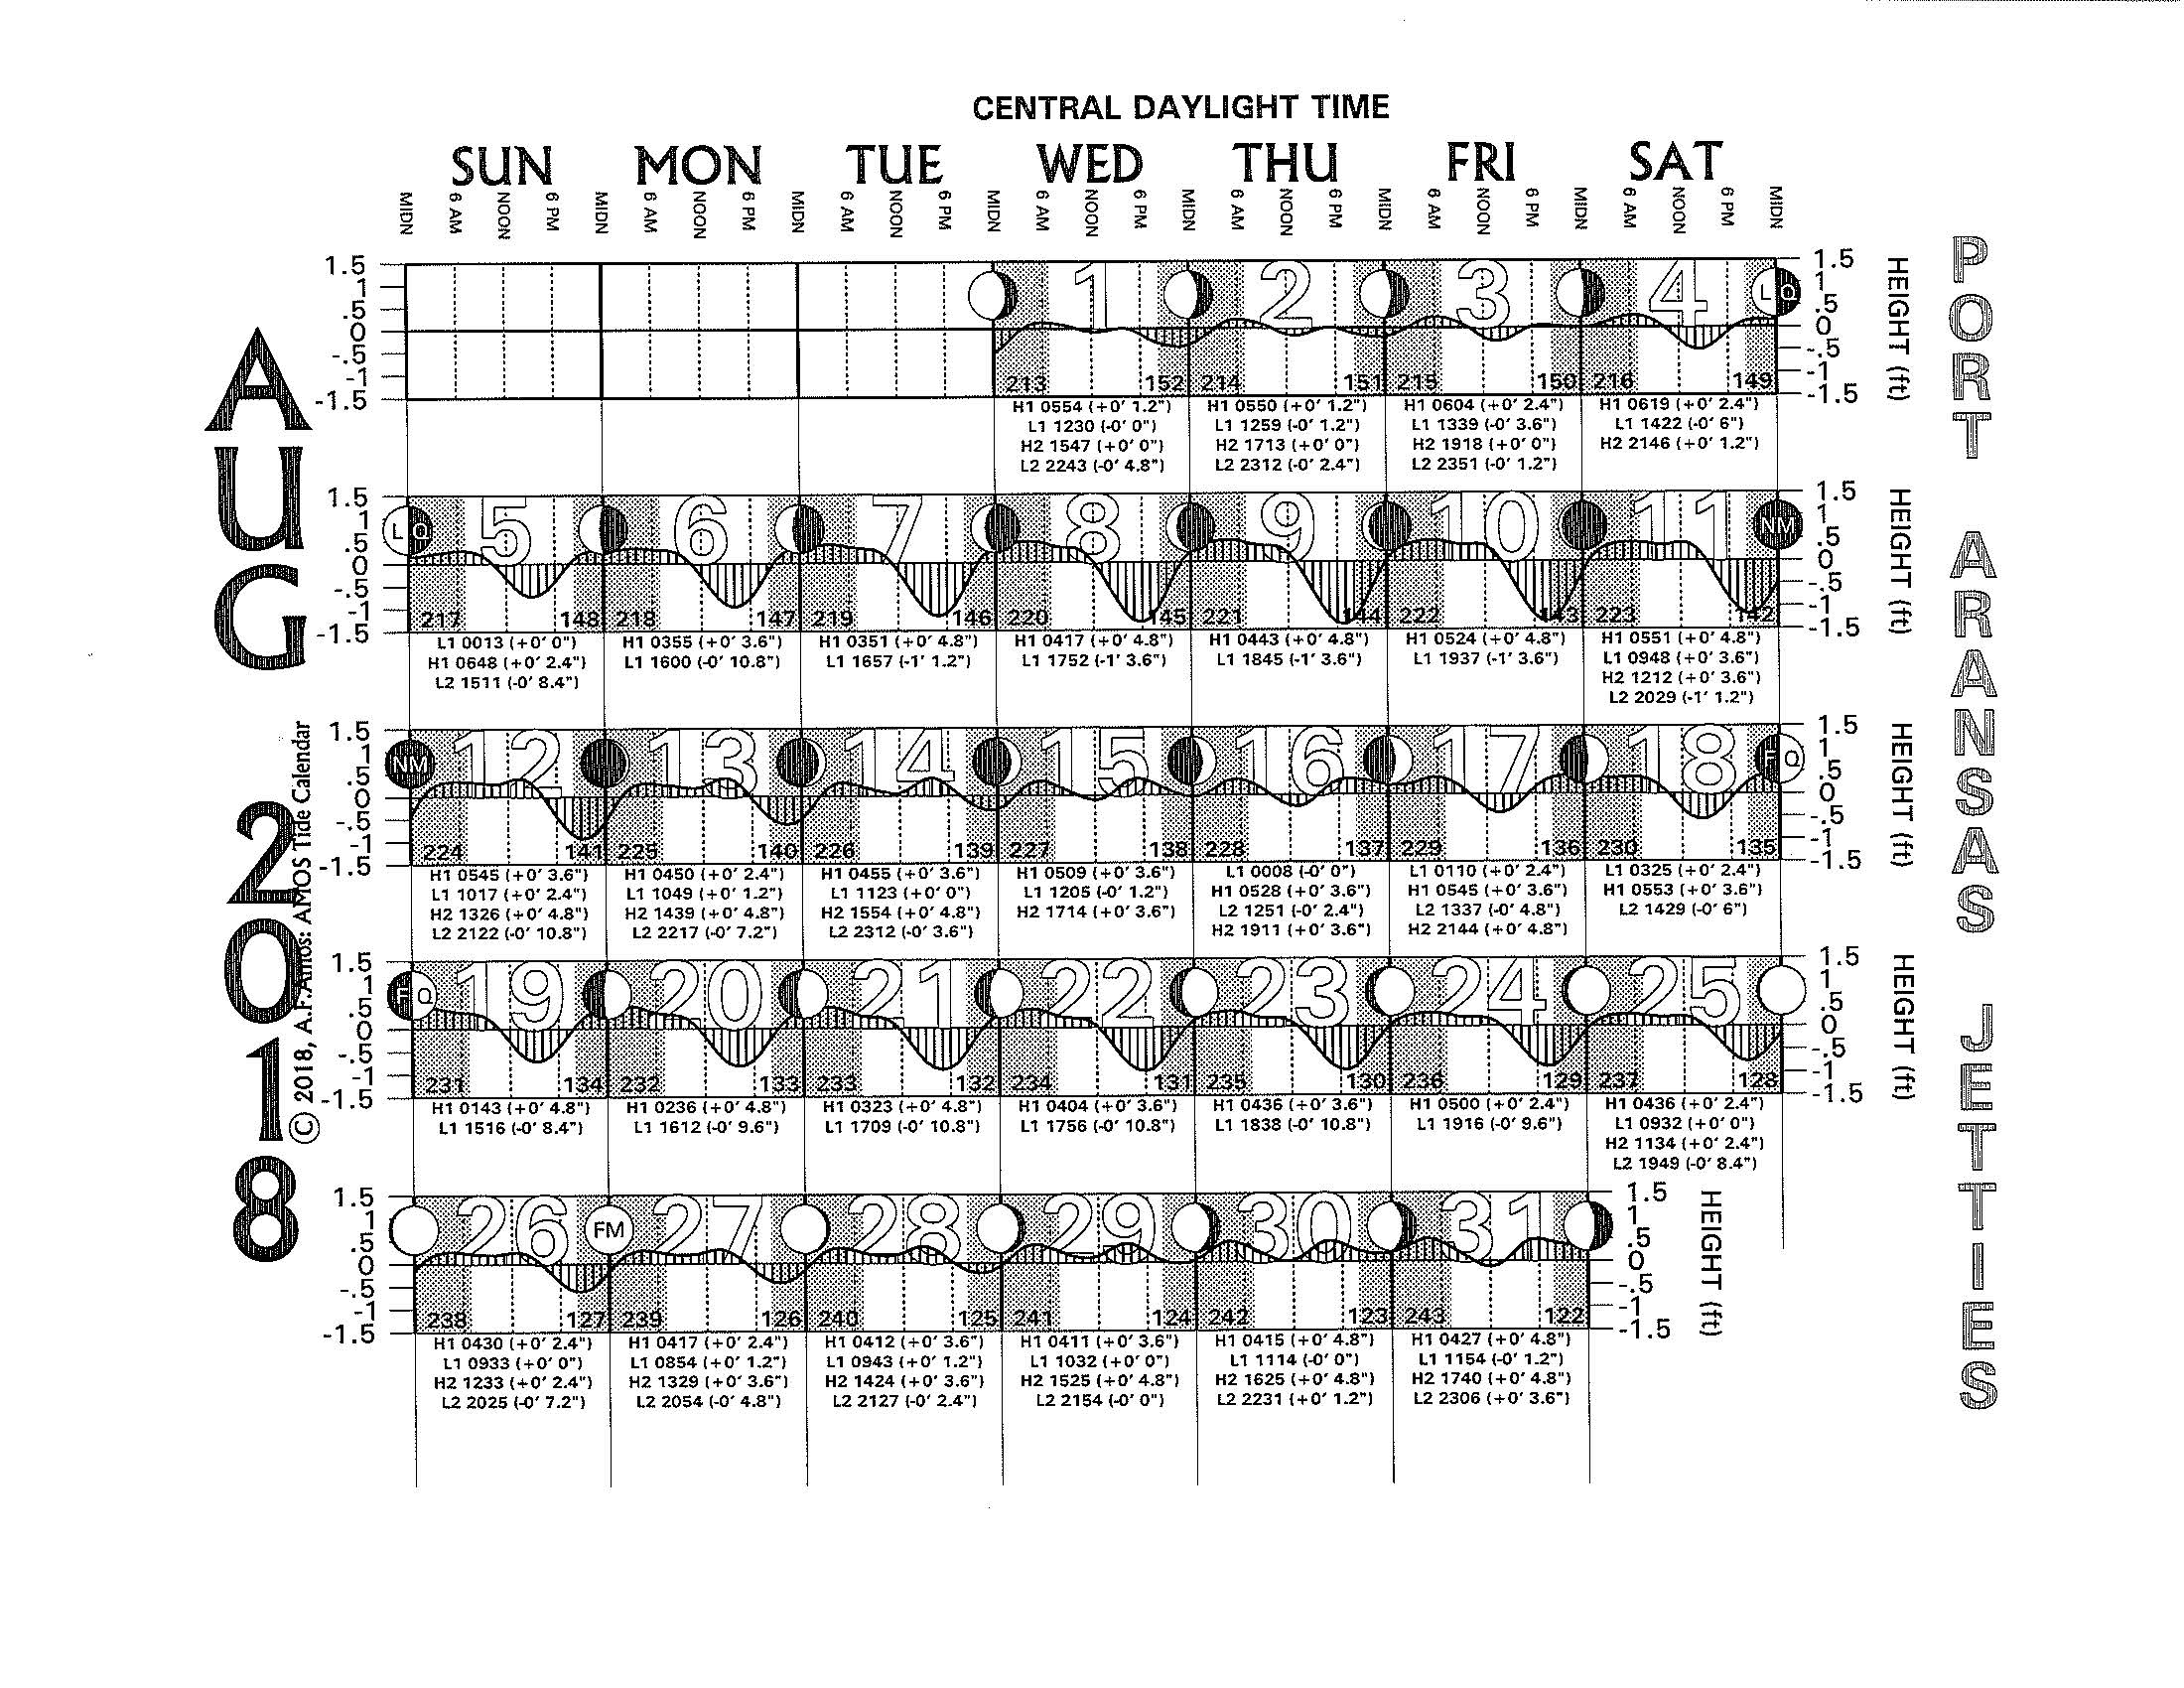
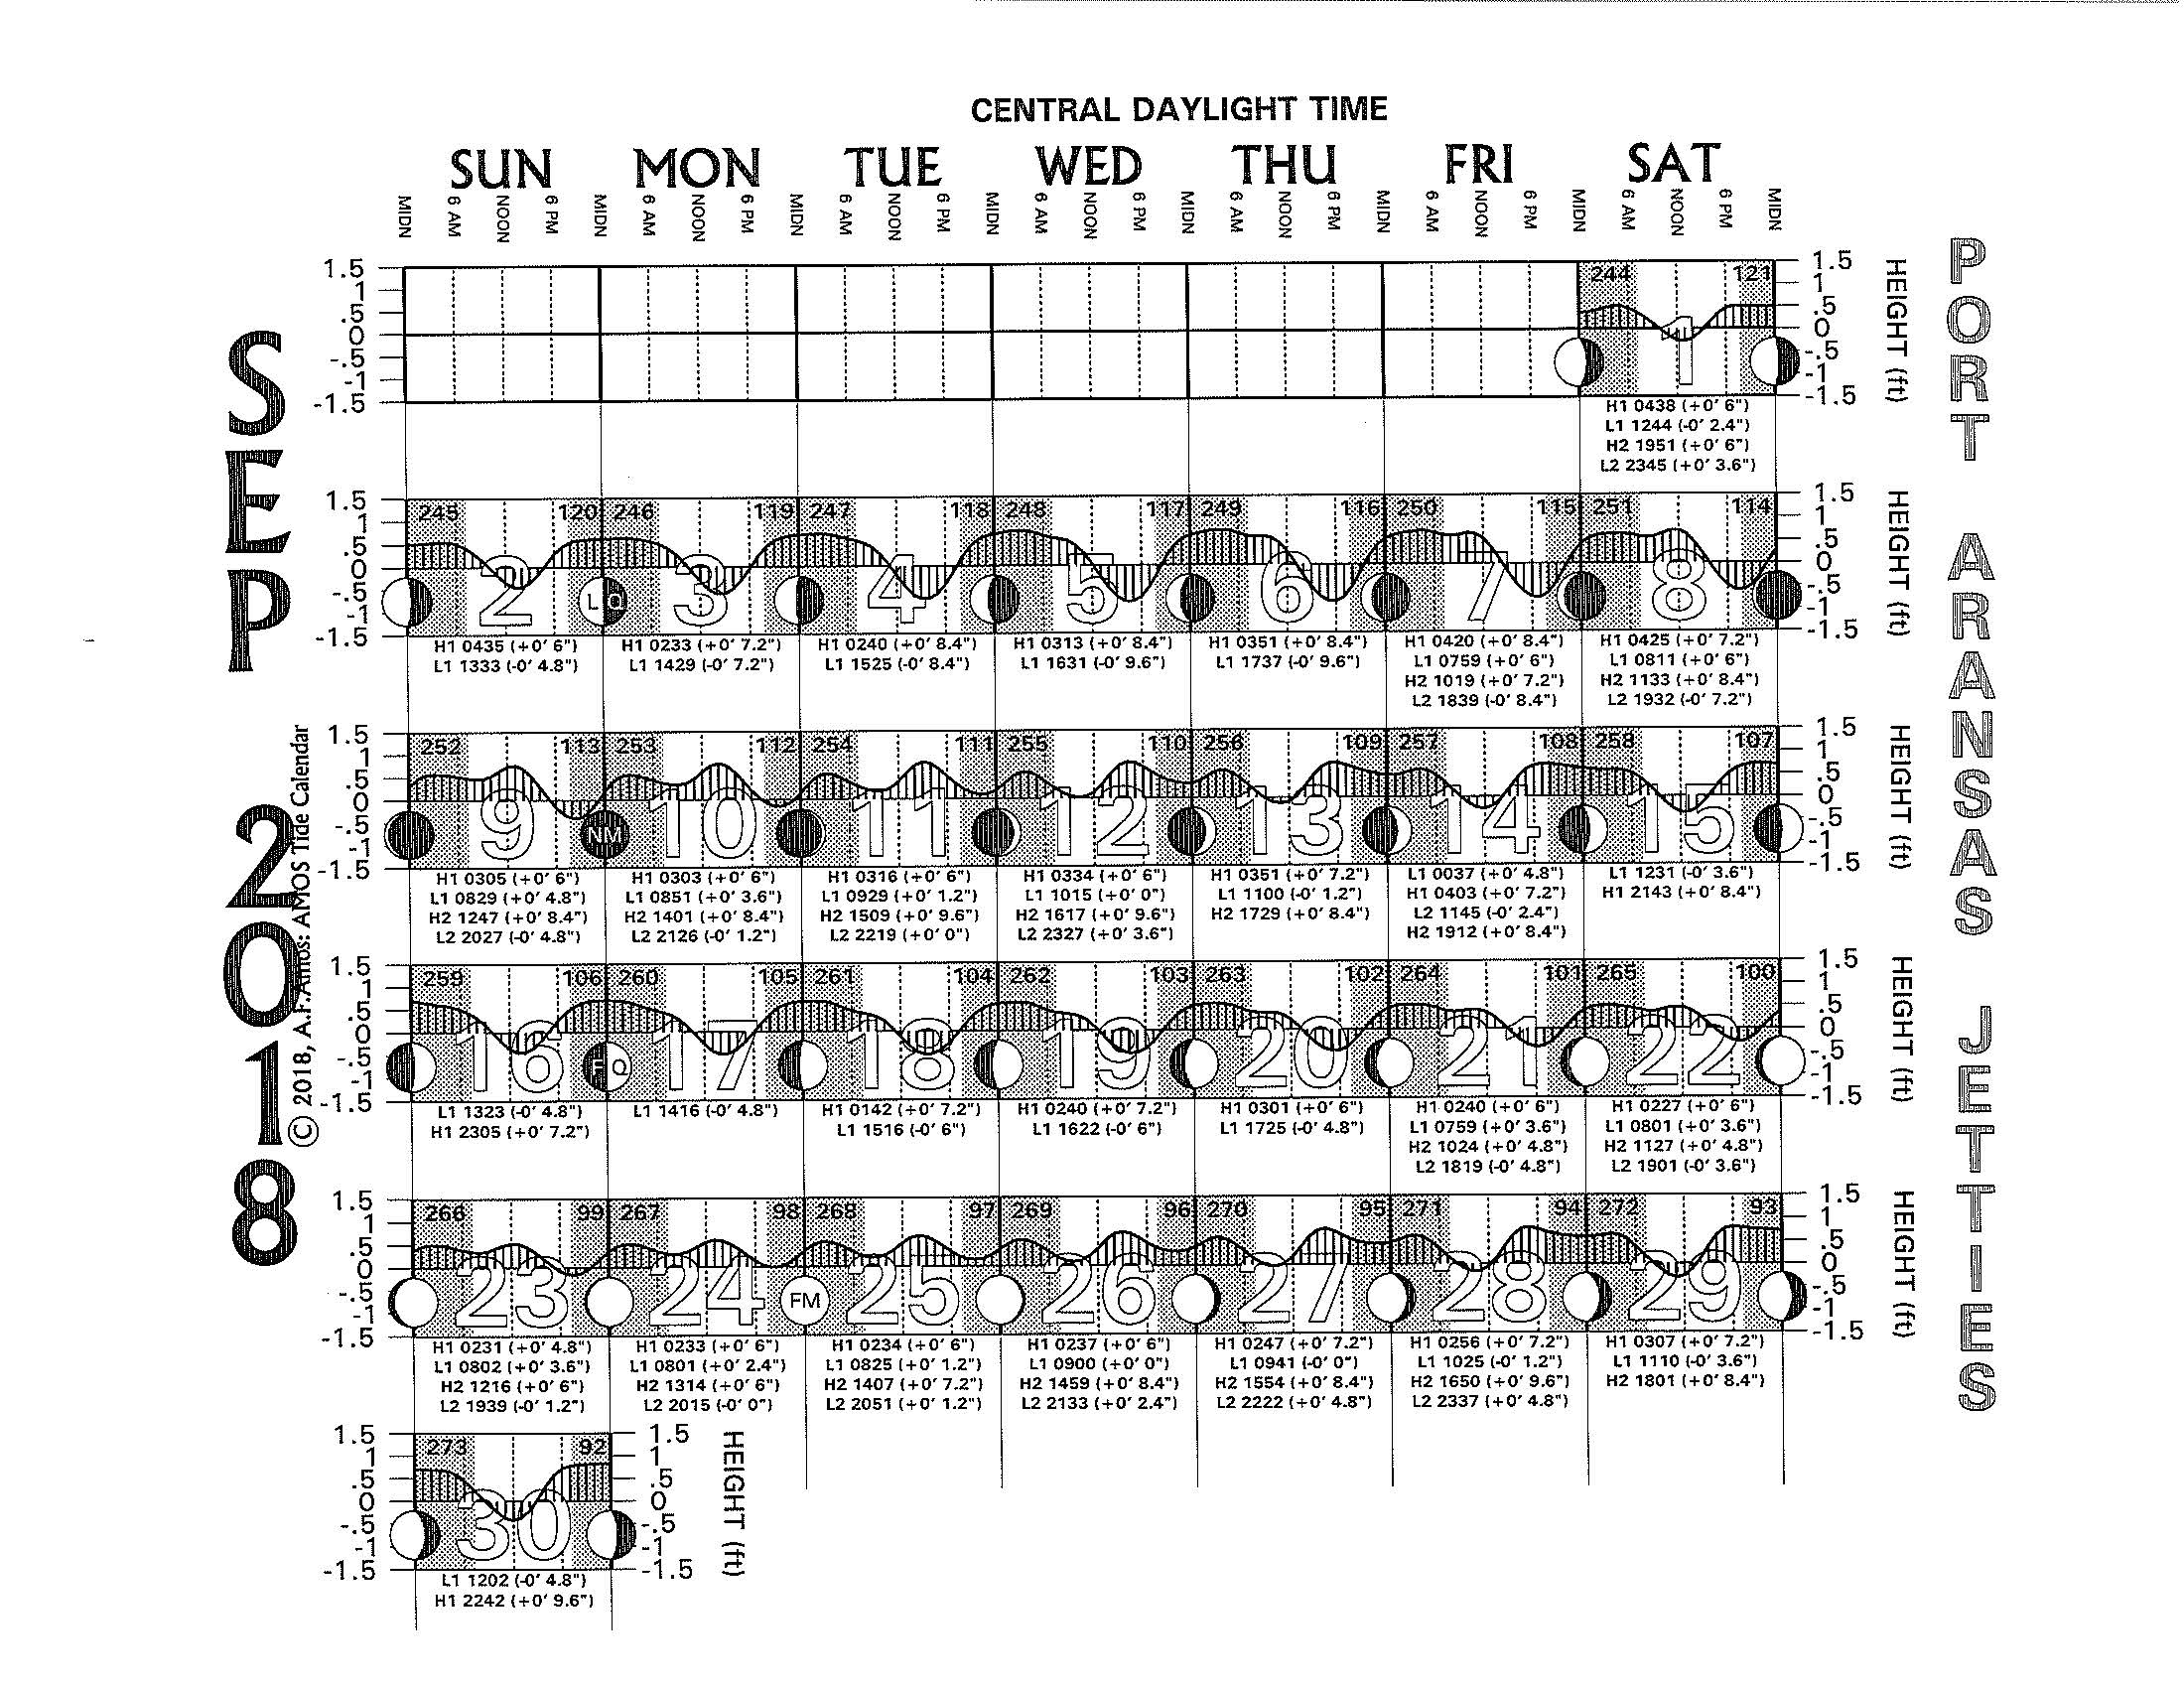
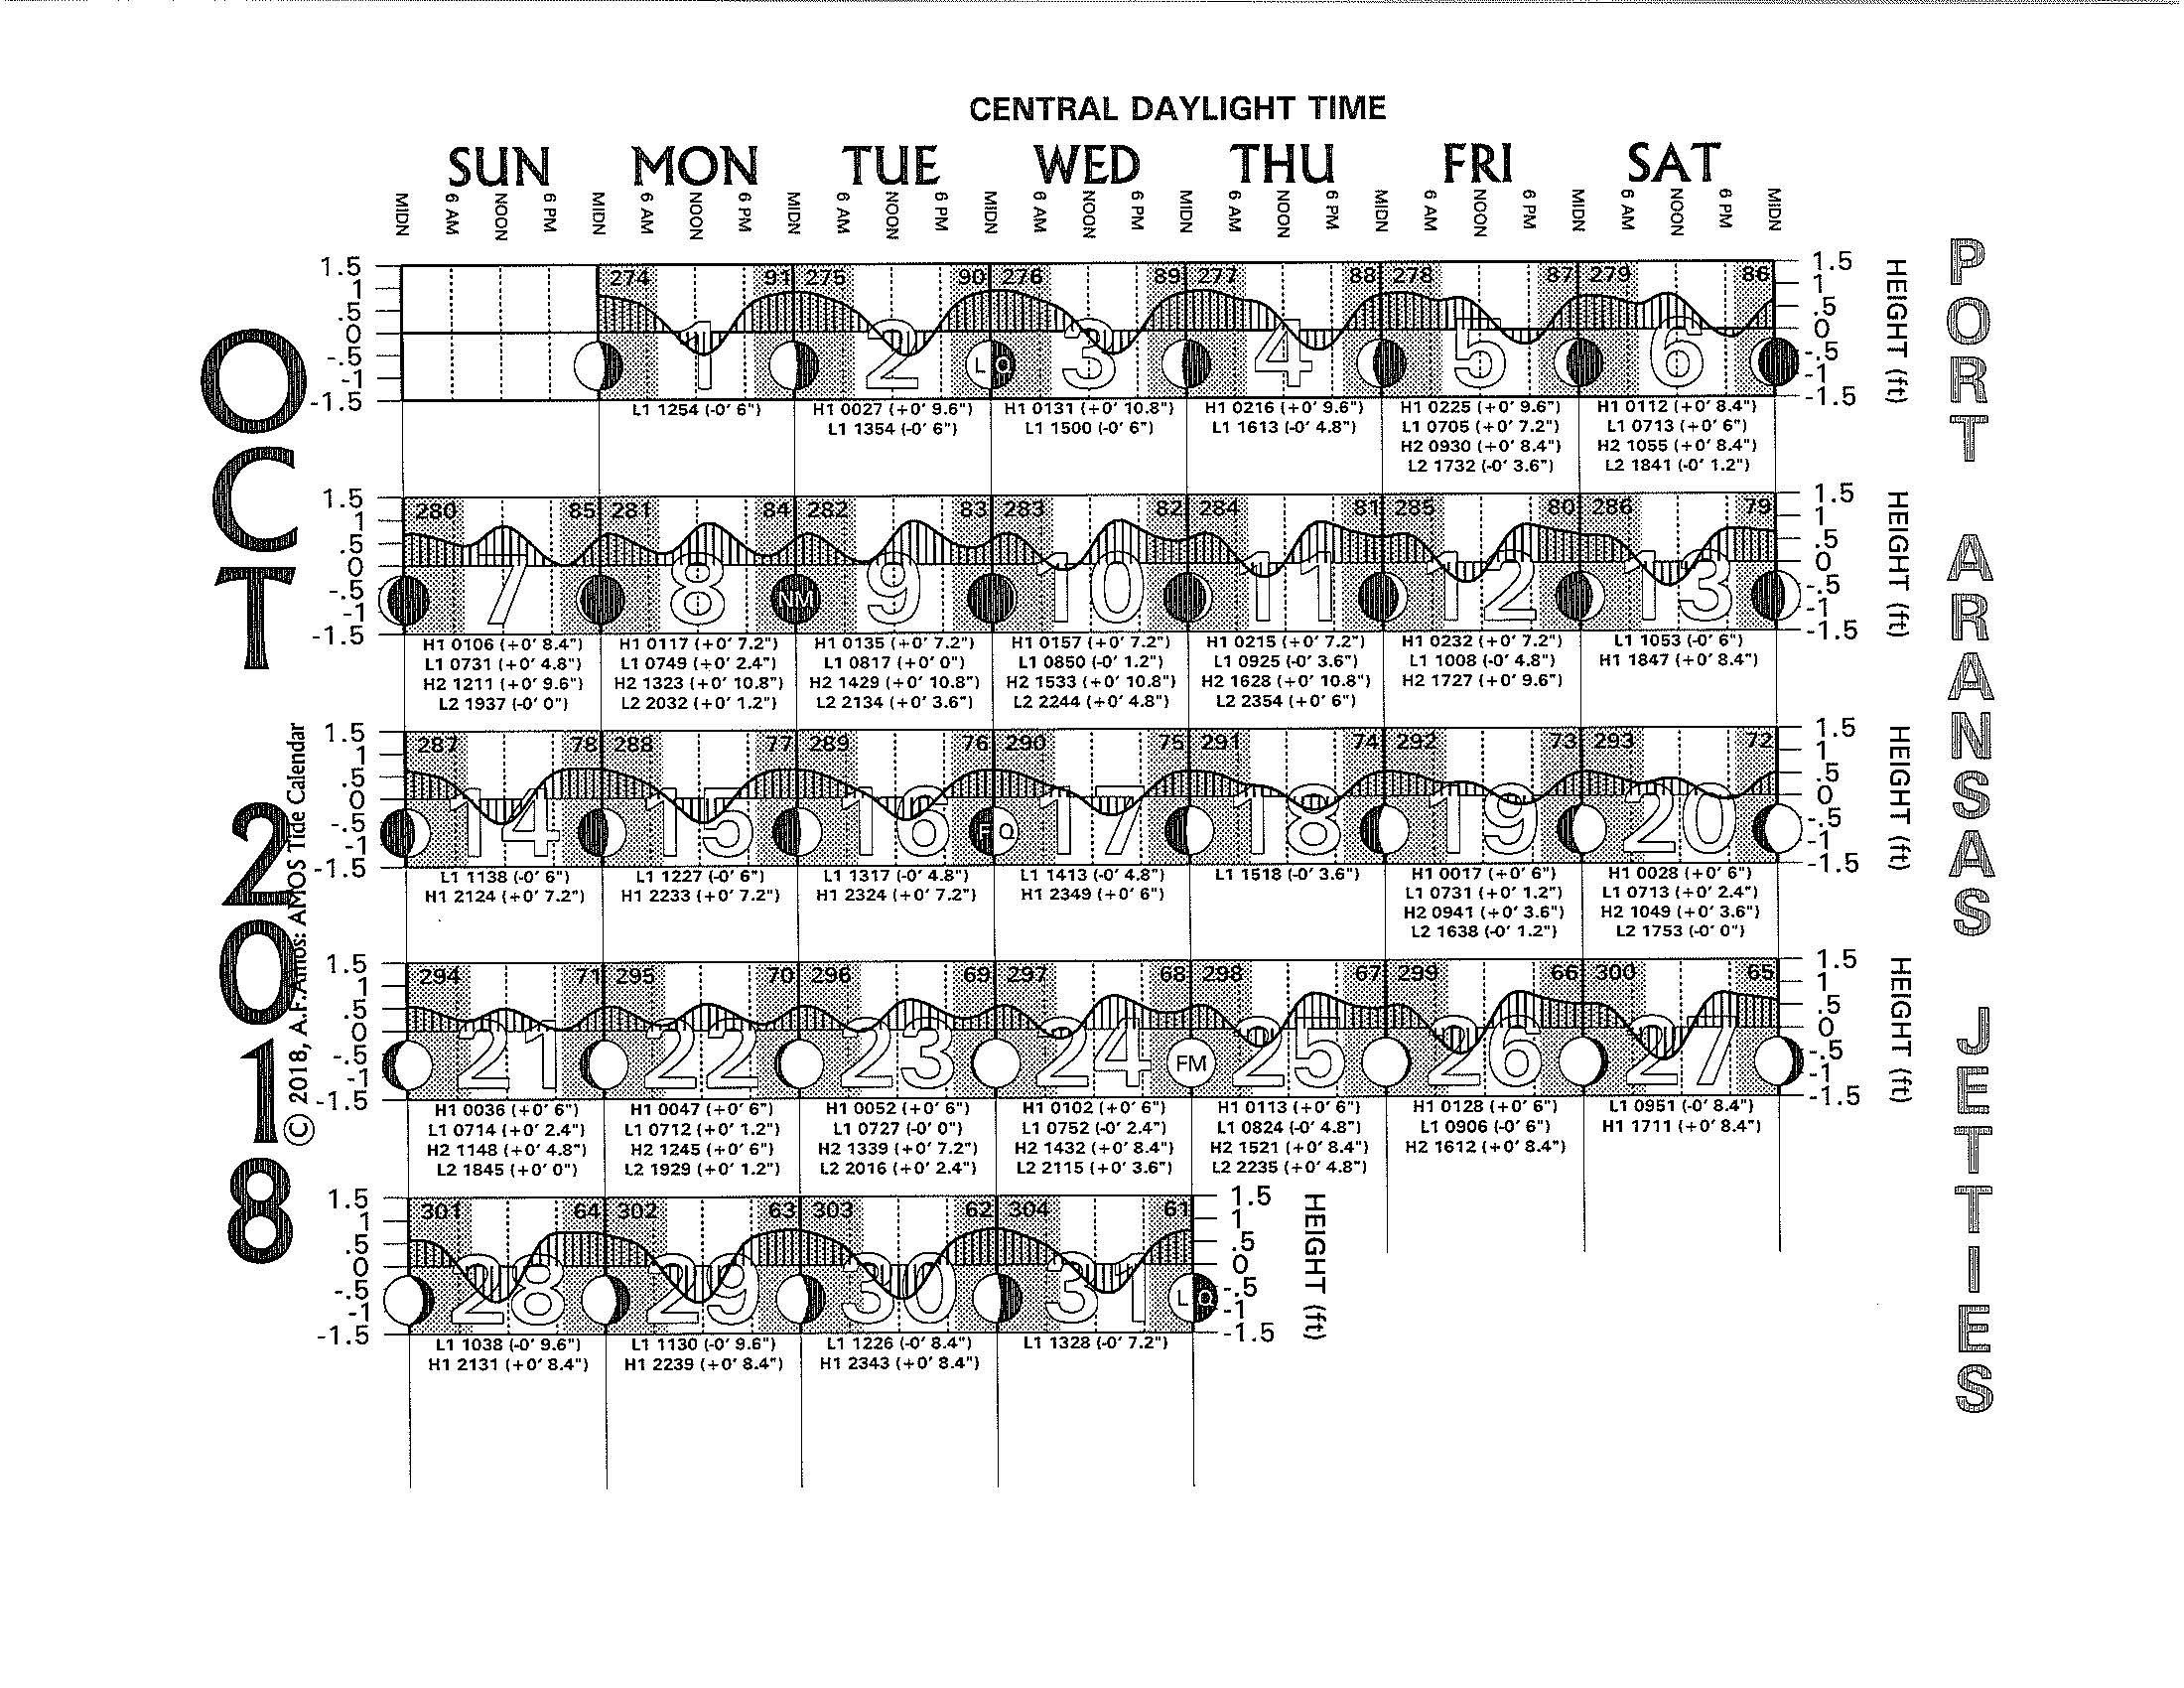
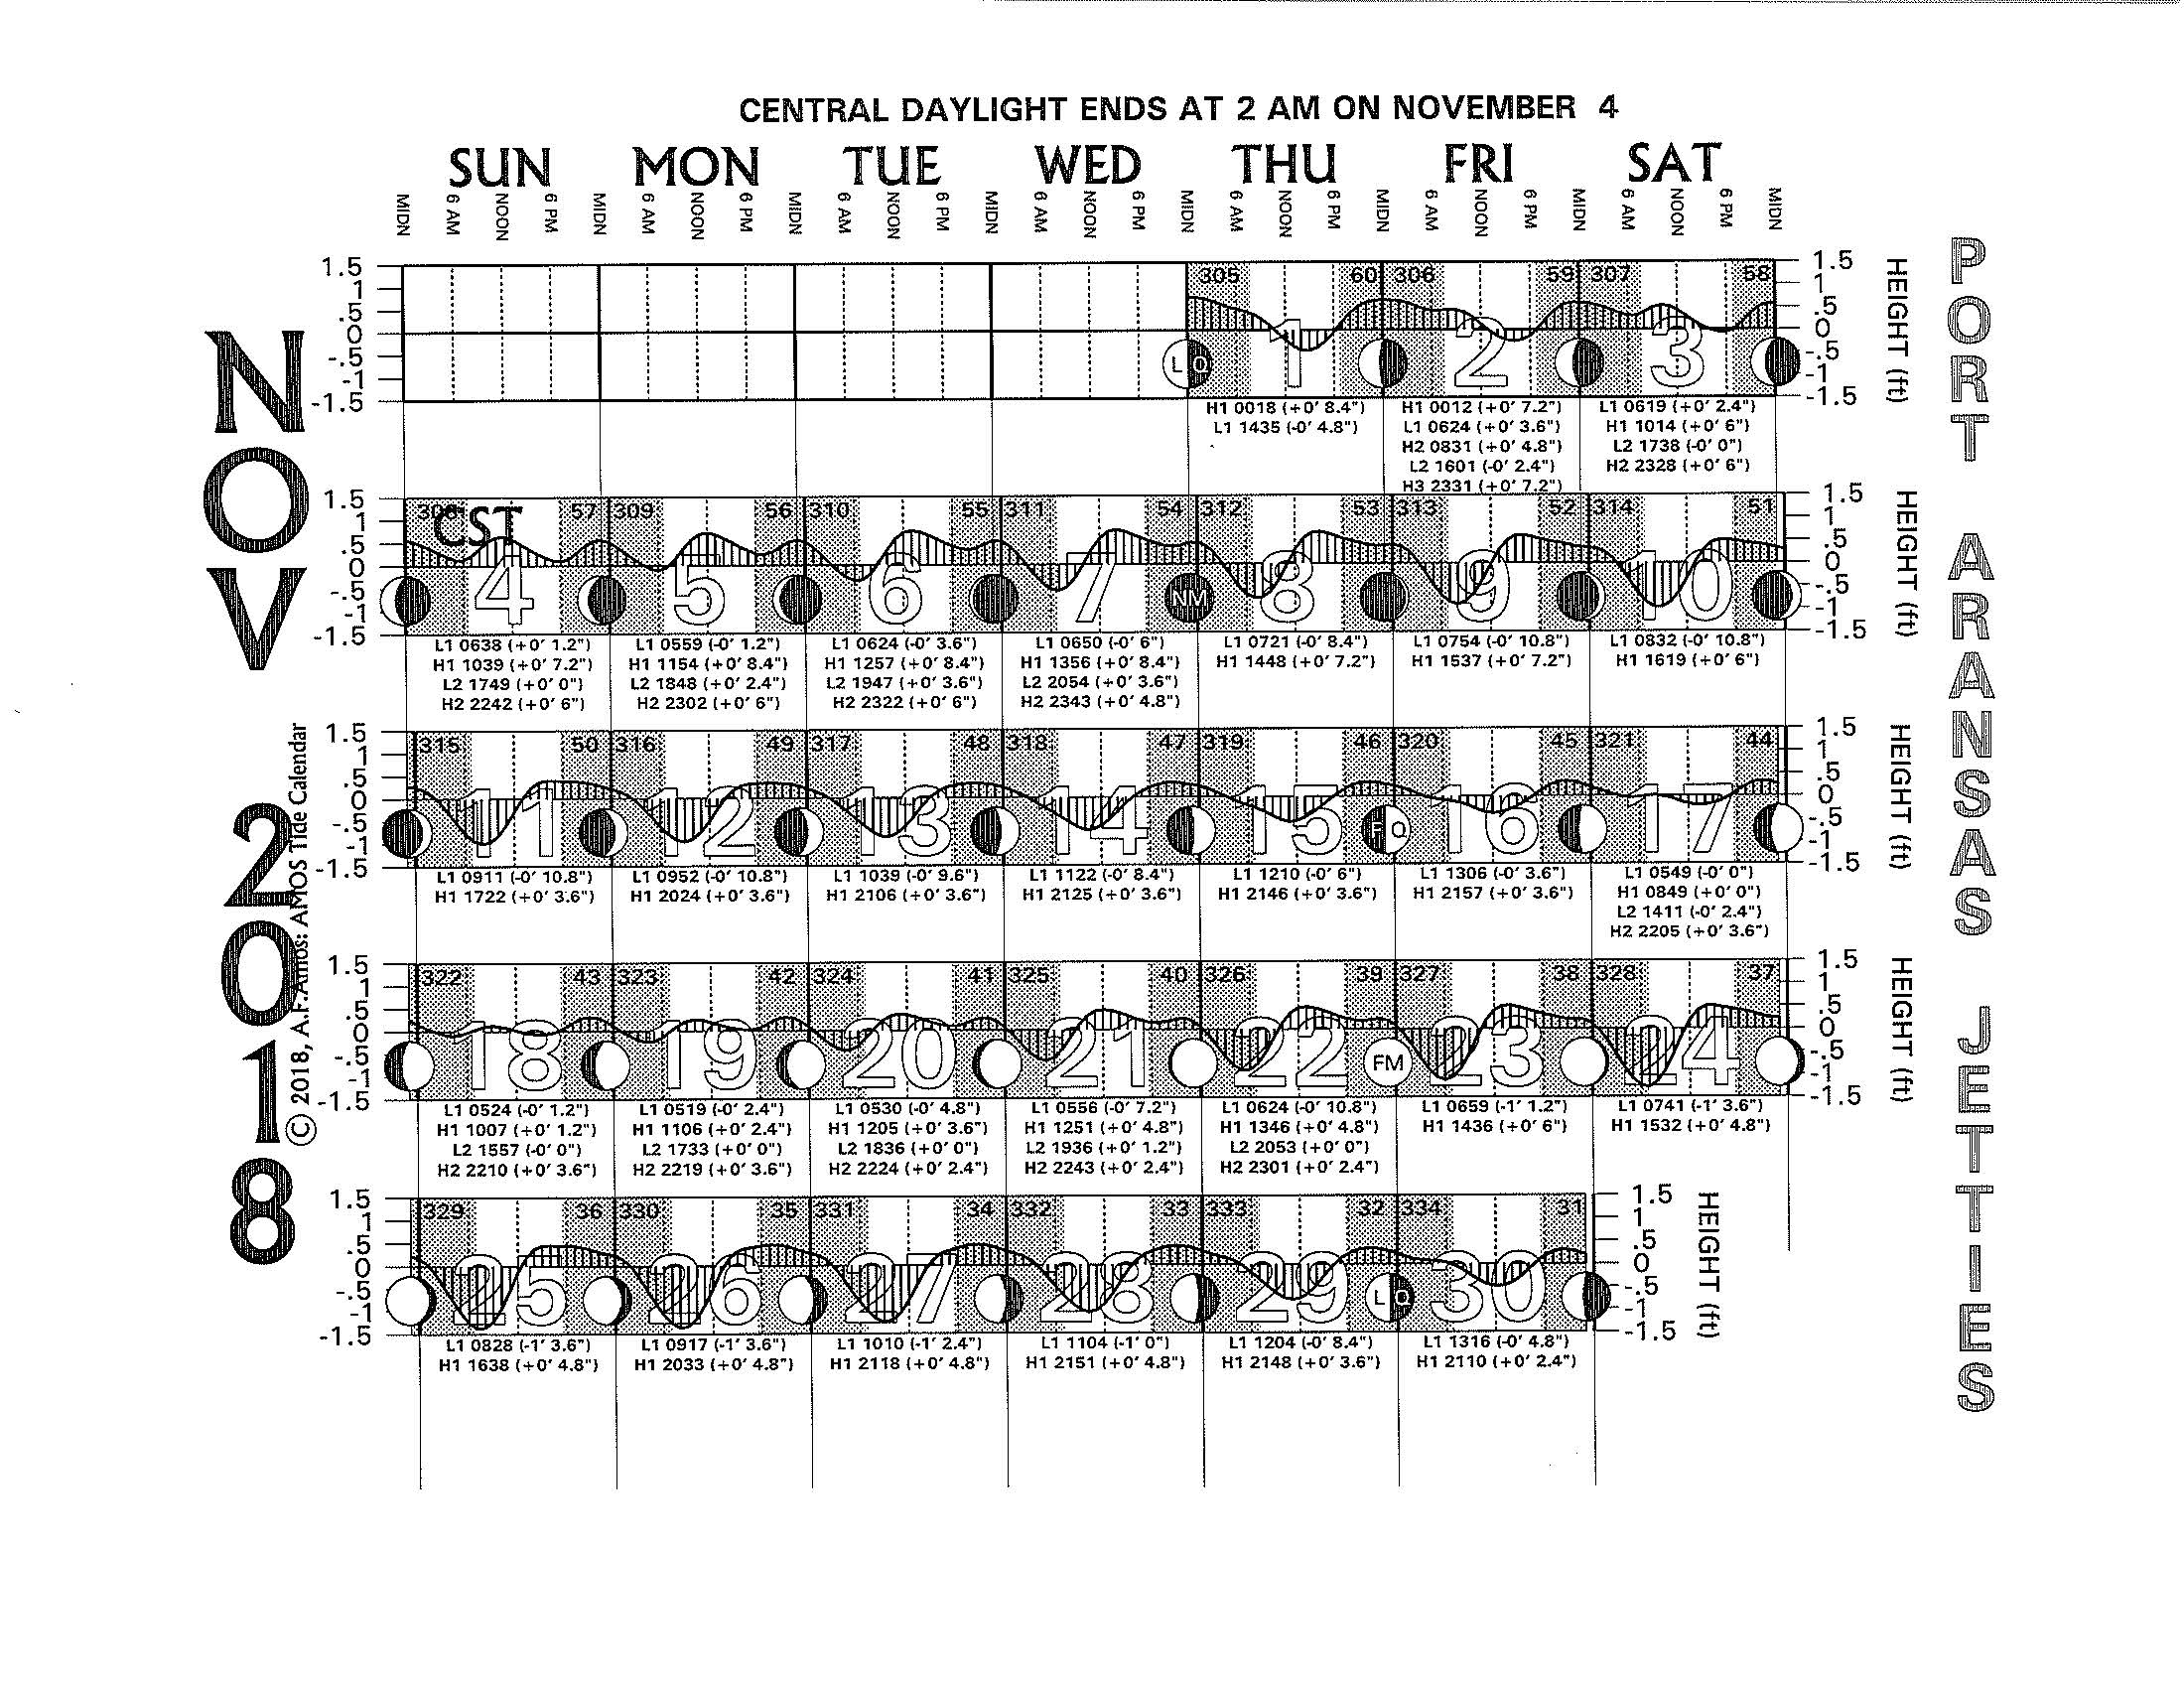
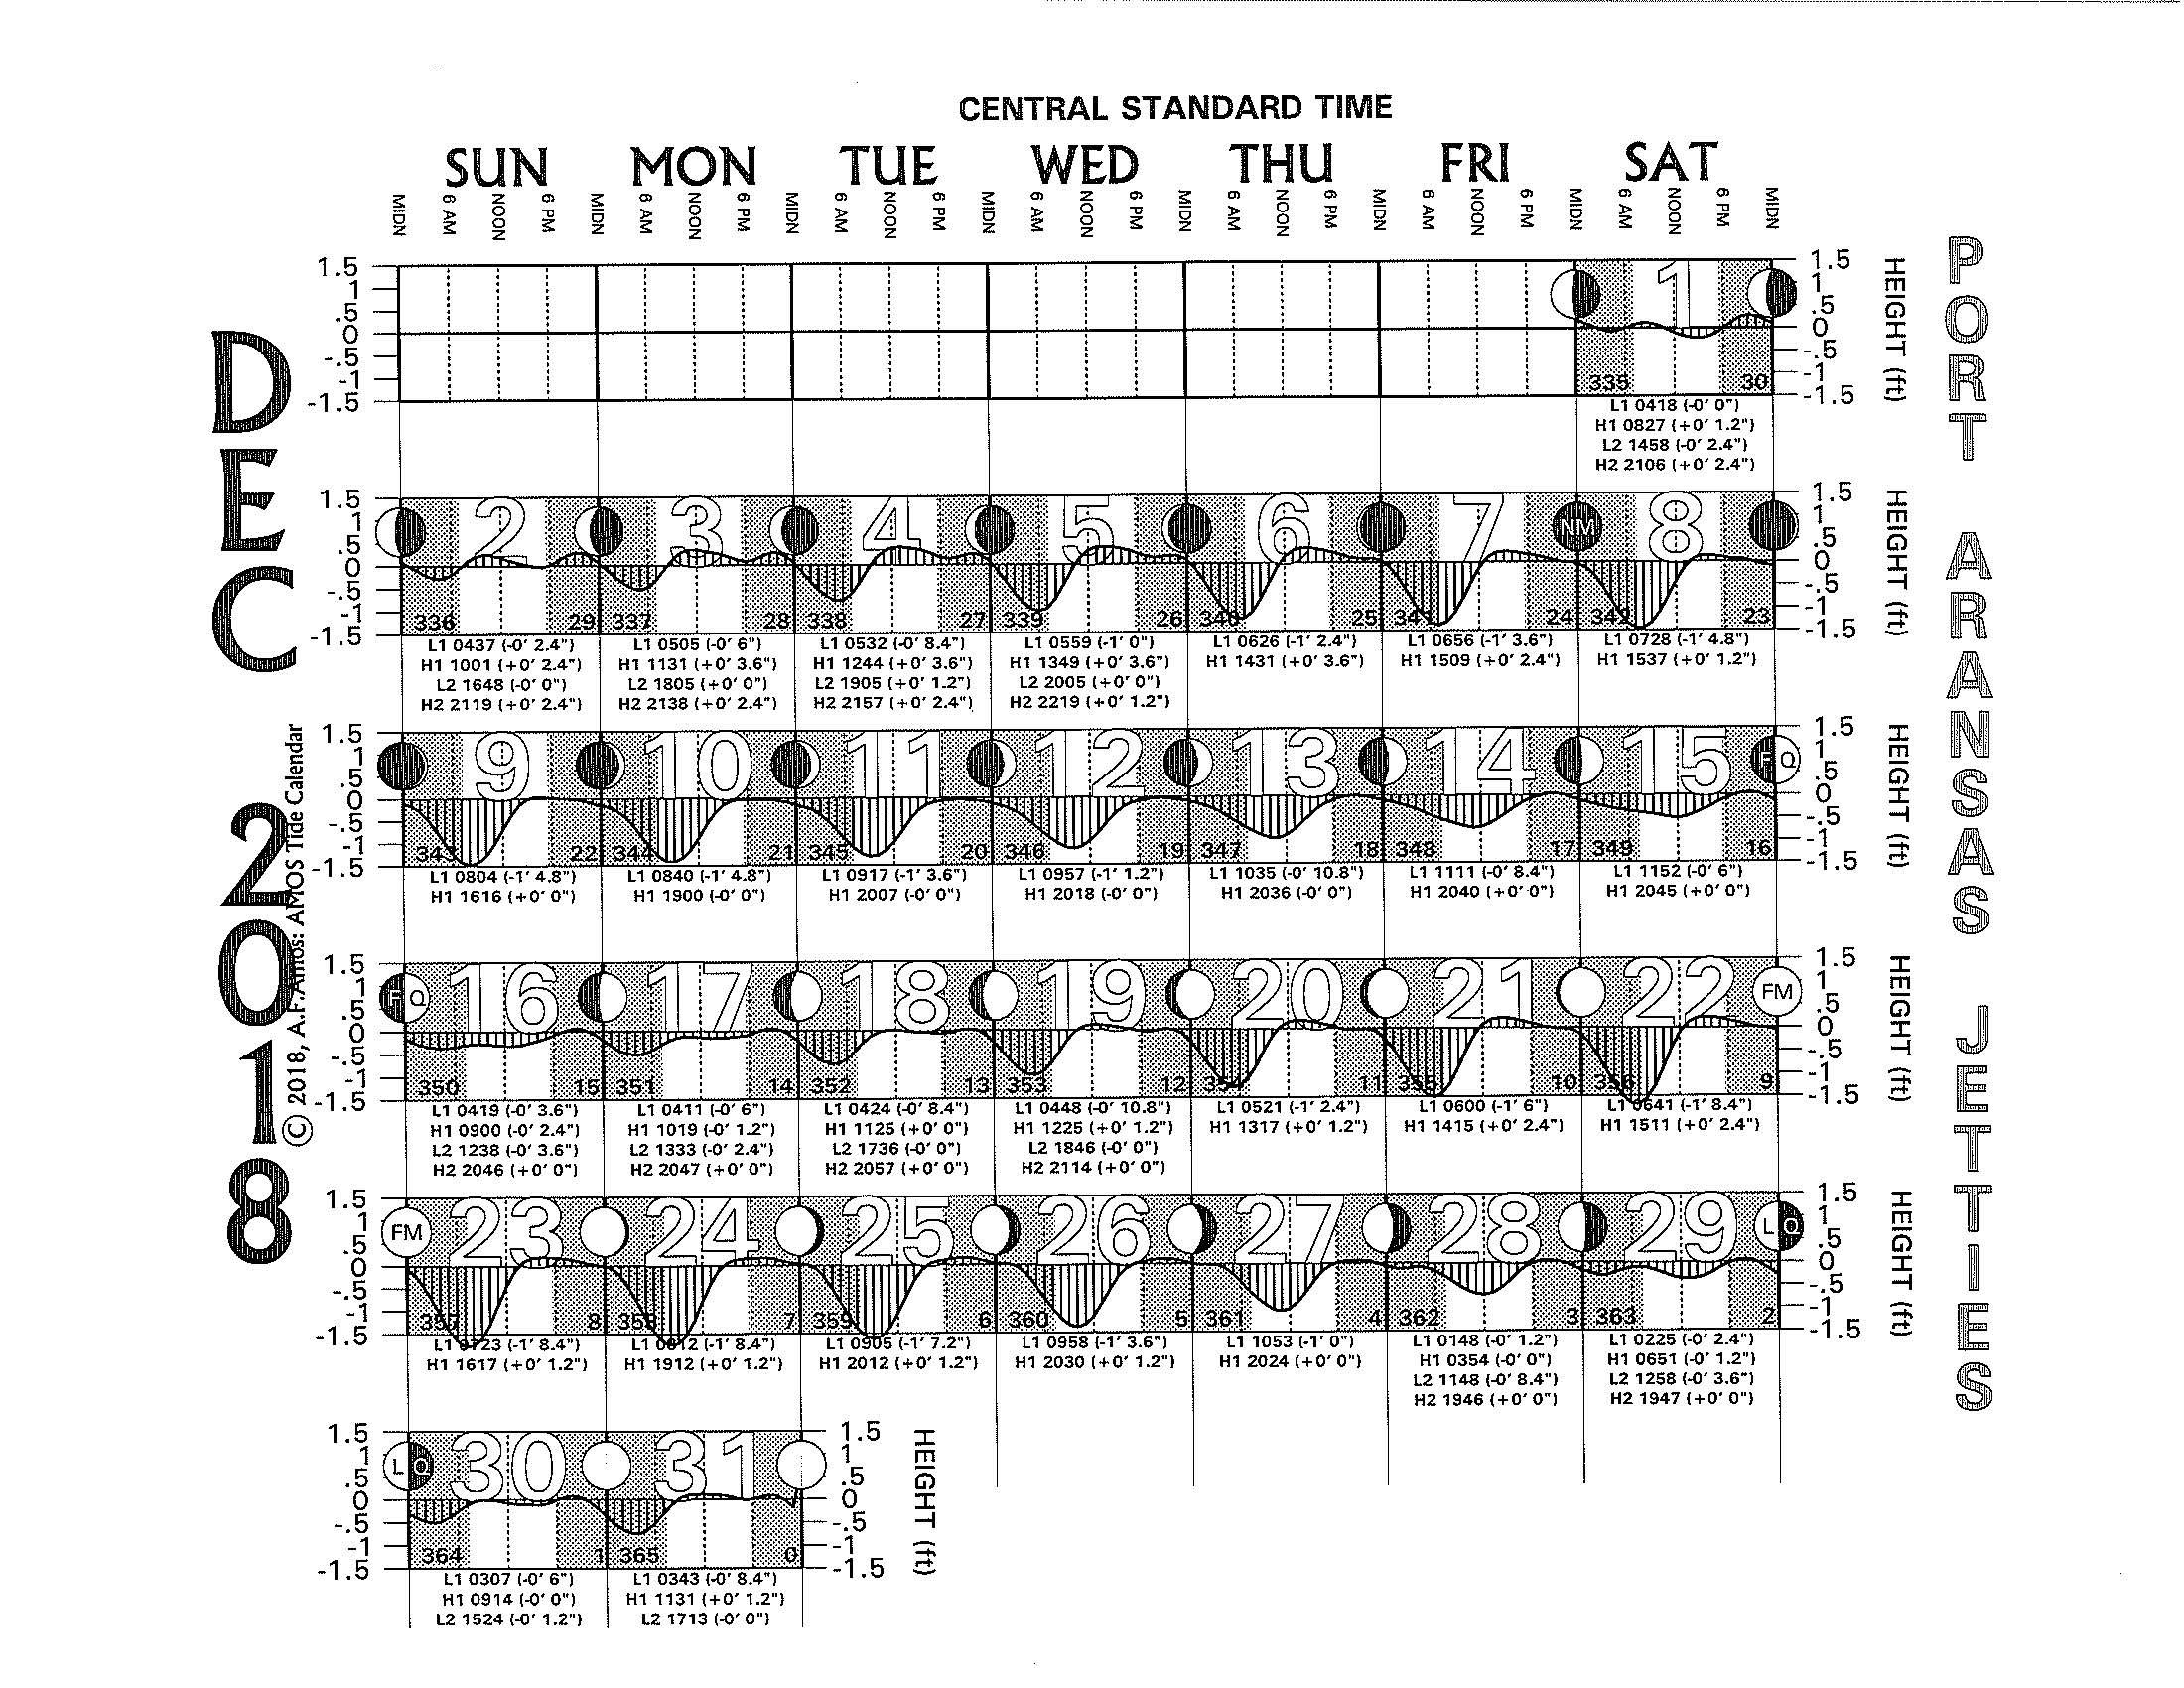
2018 Tide Charts - Texas Tides: Port Aransas Jetties
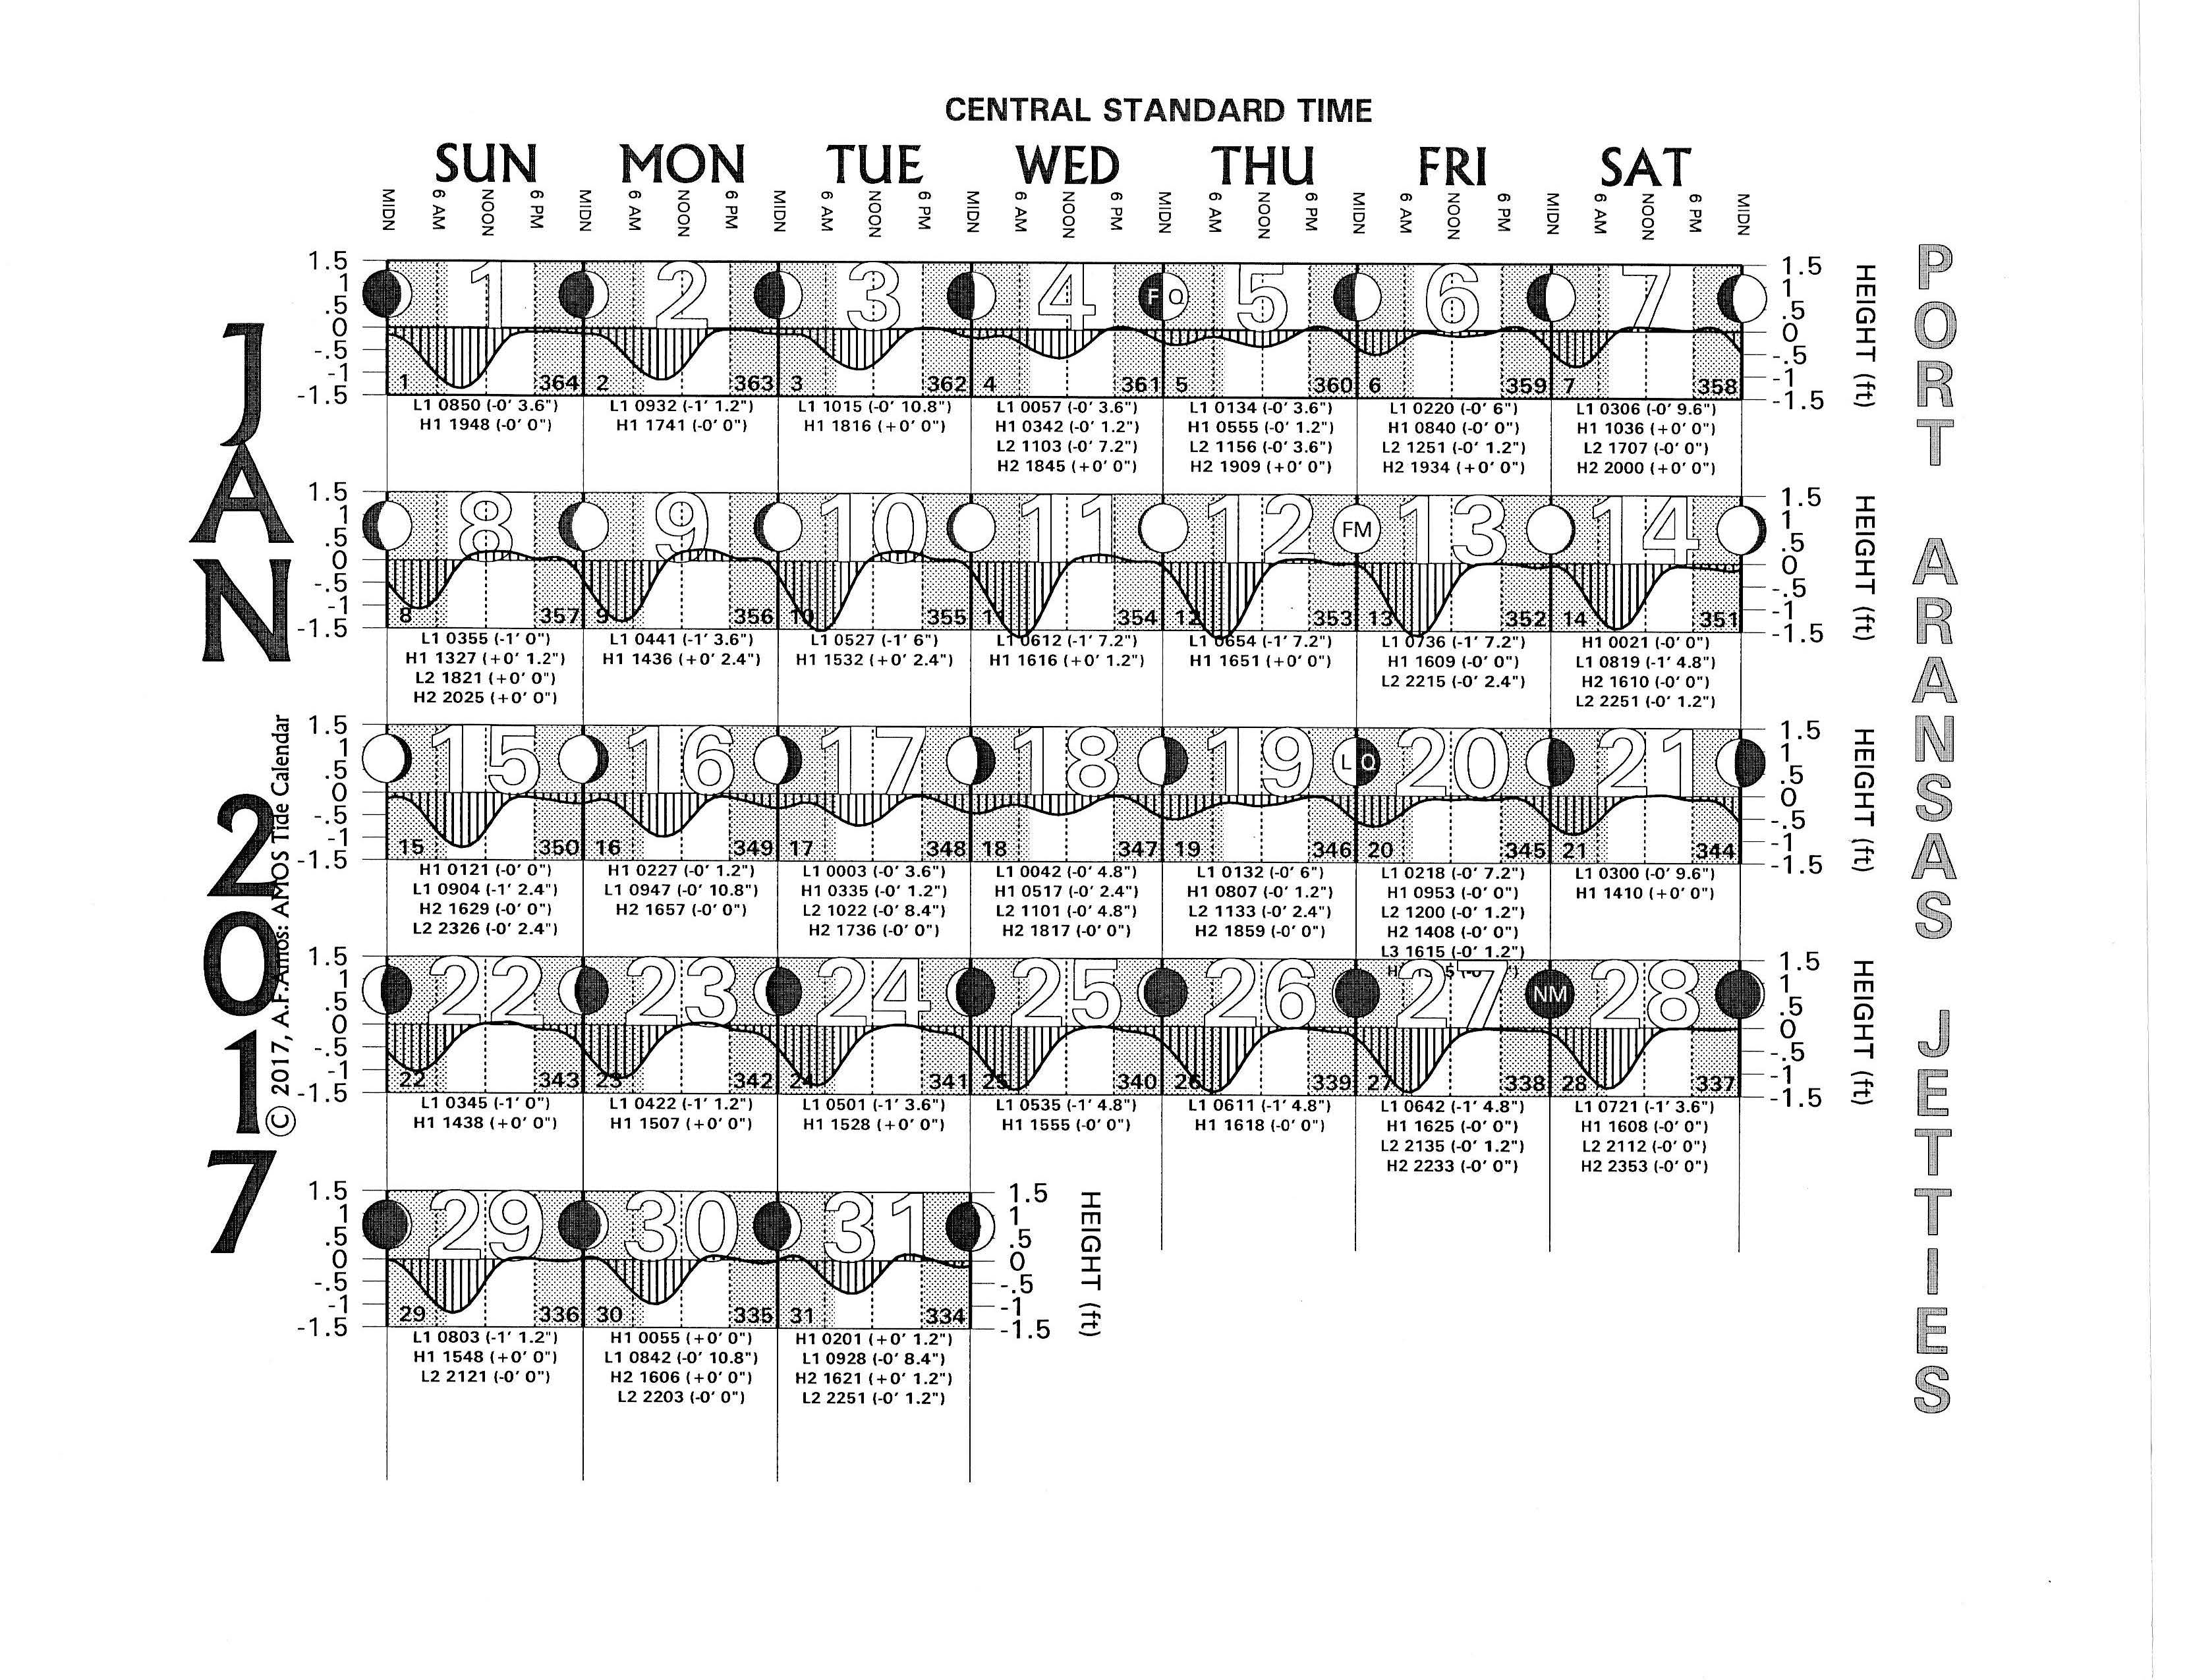
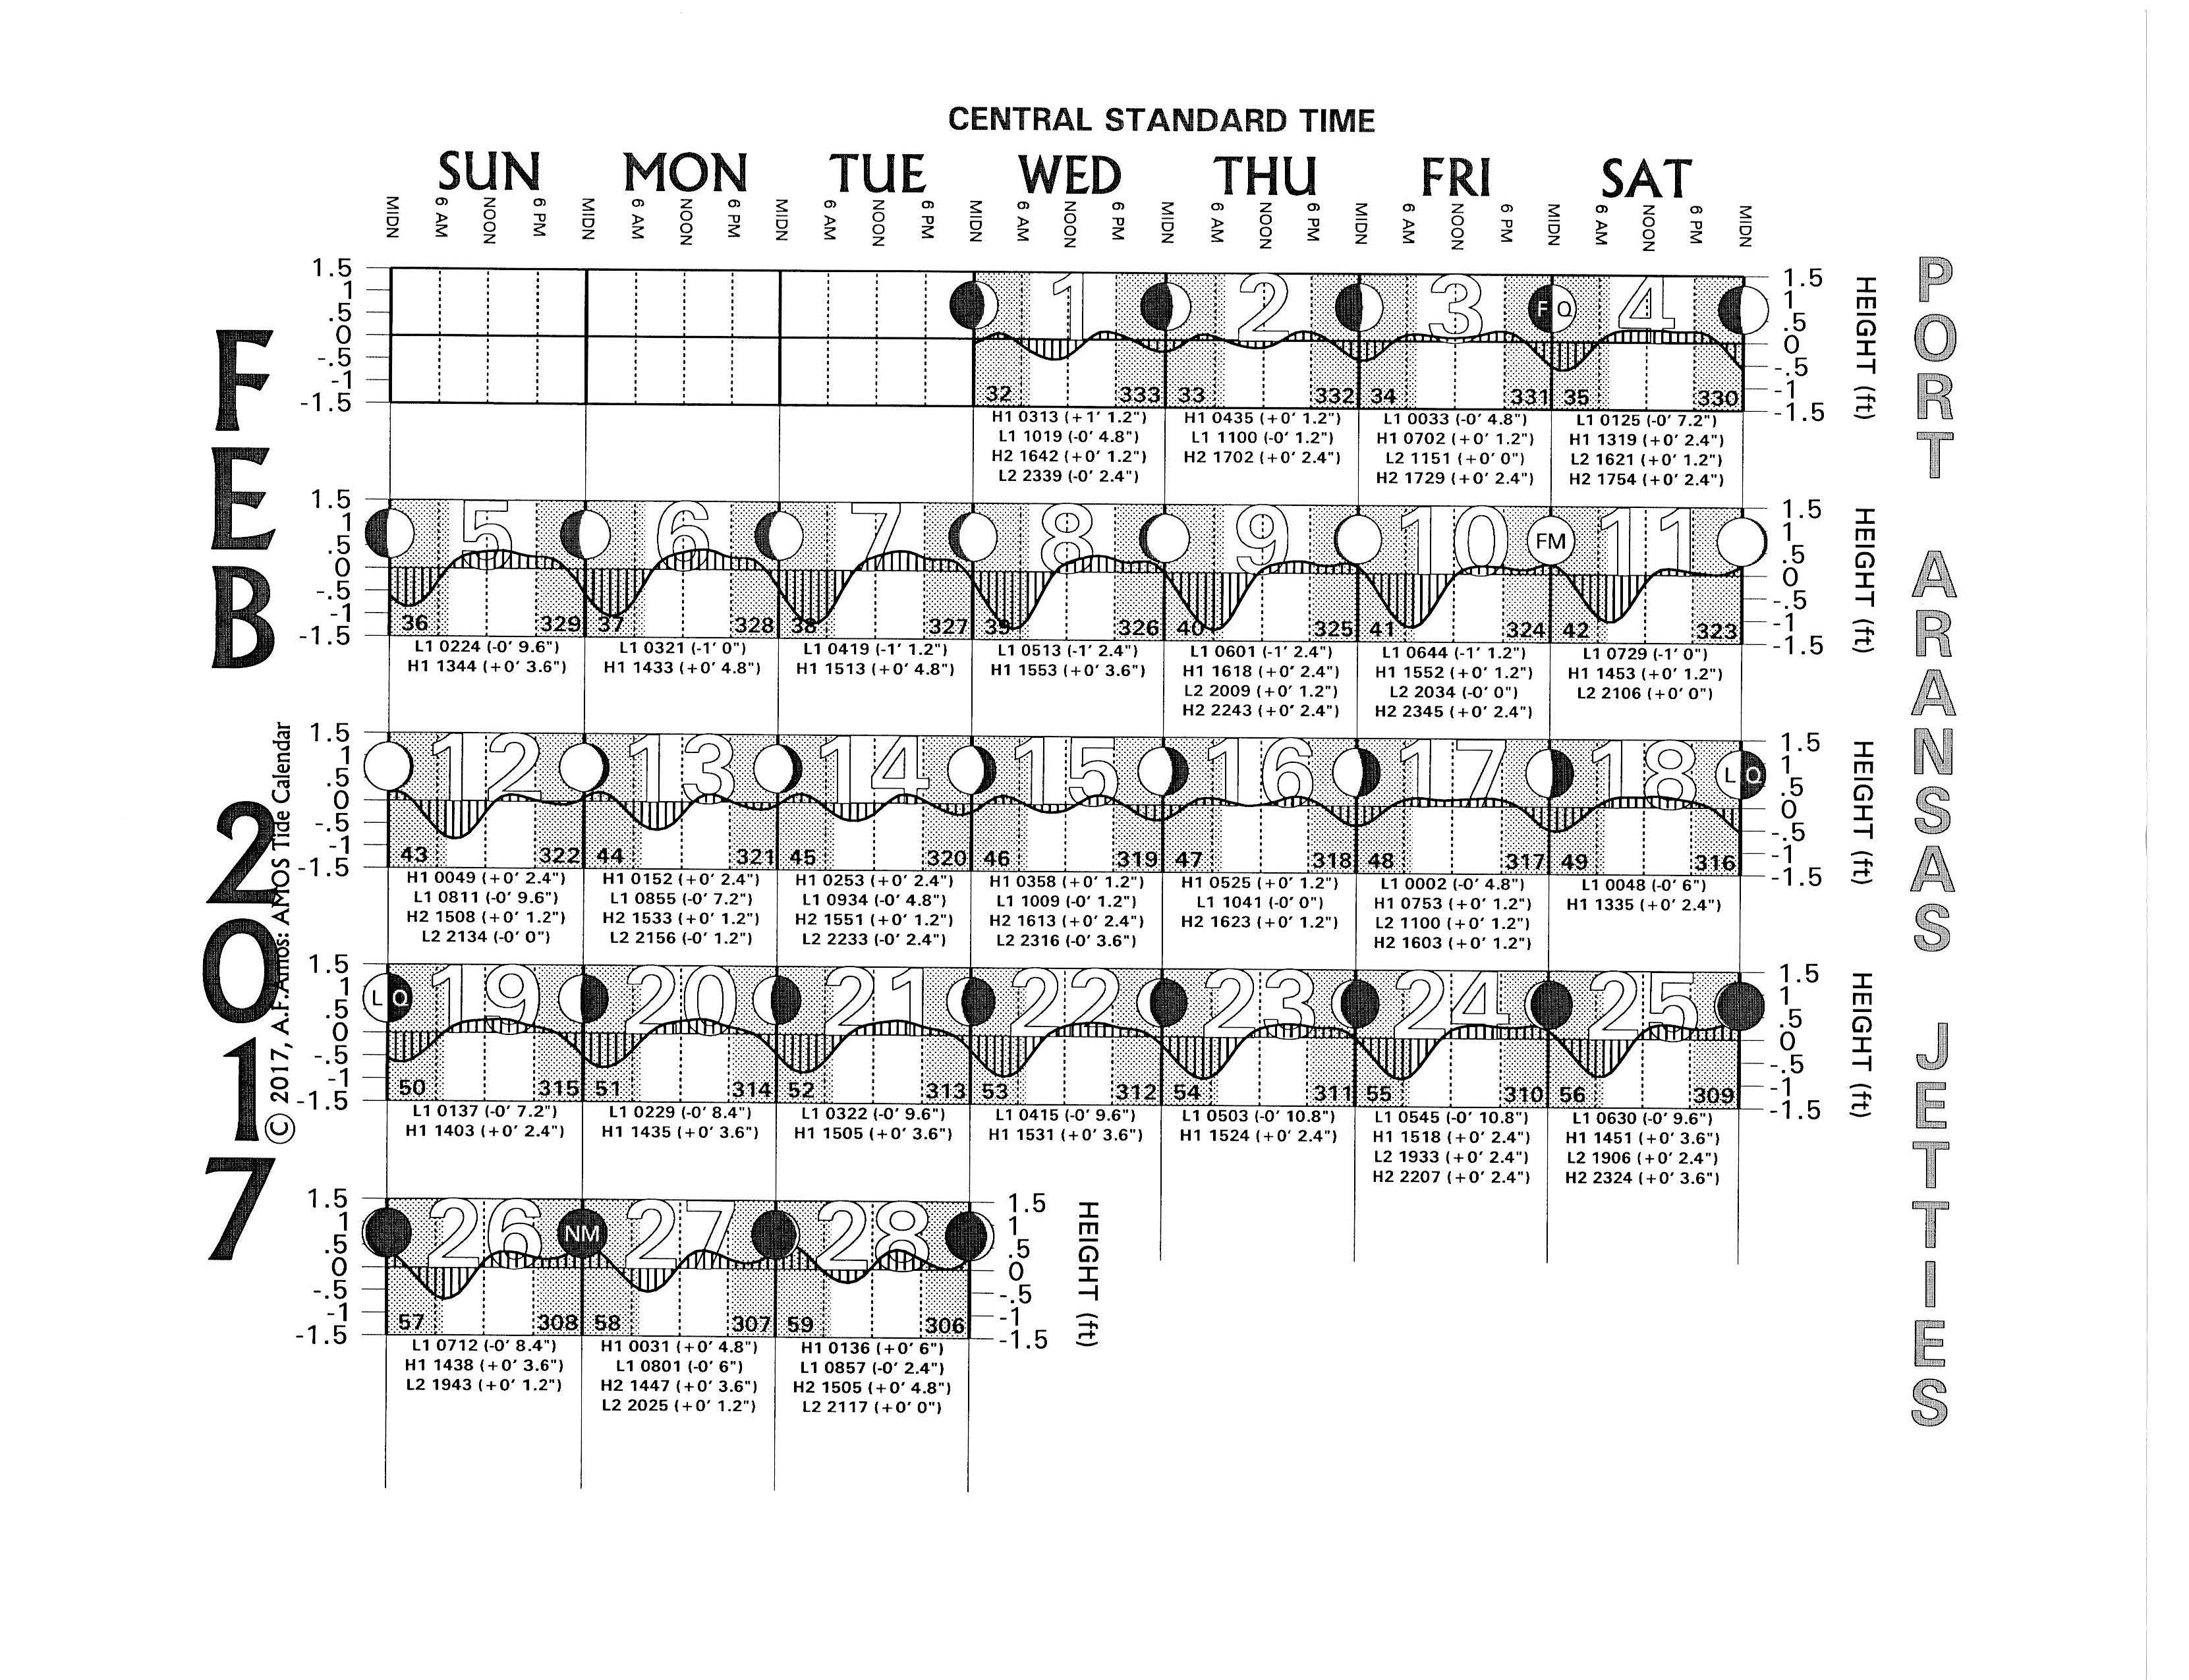
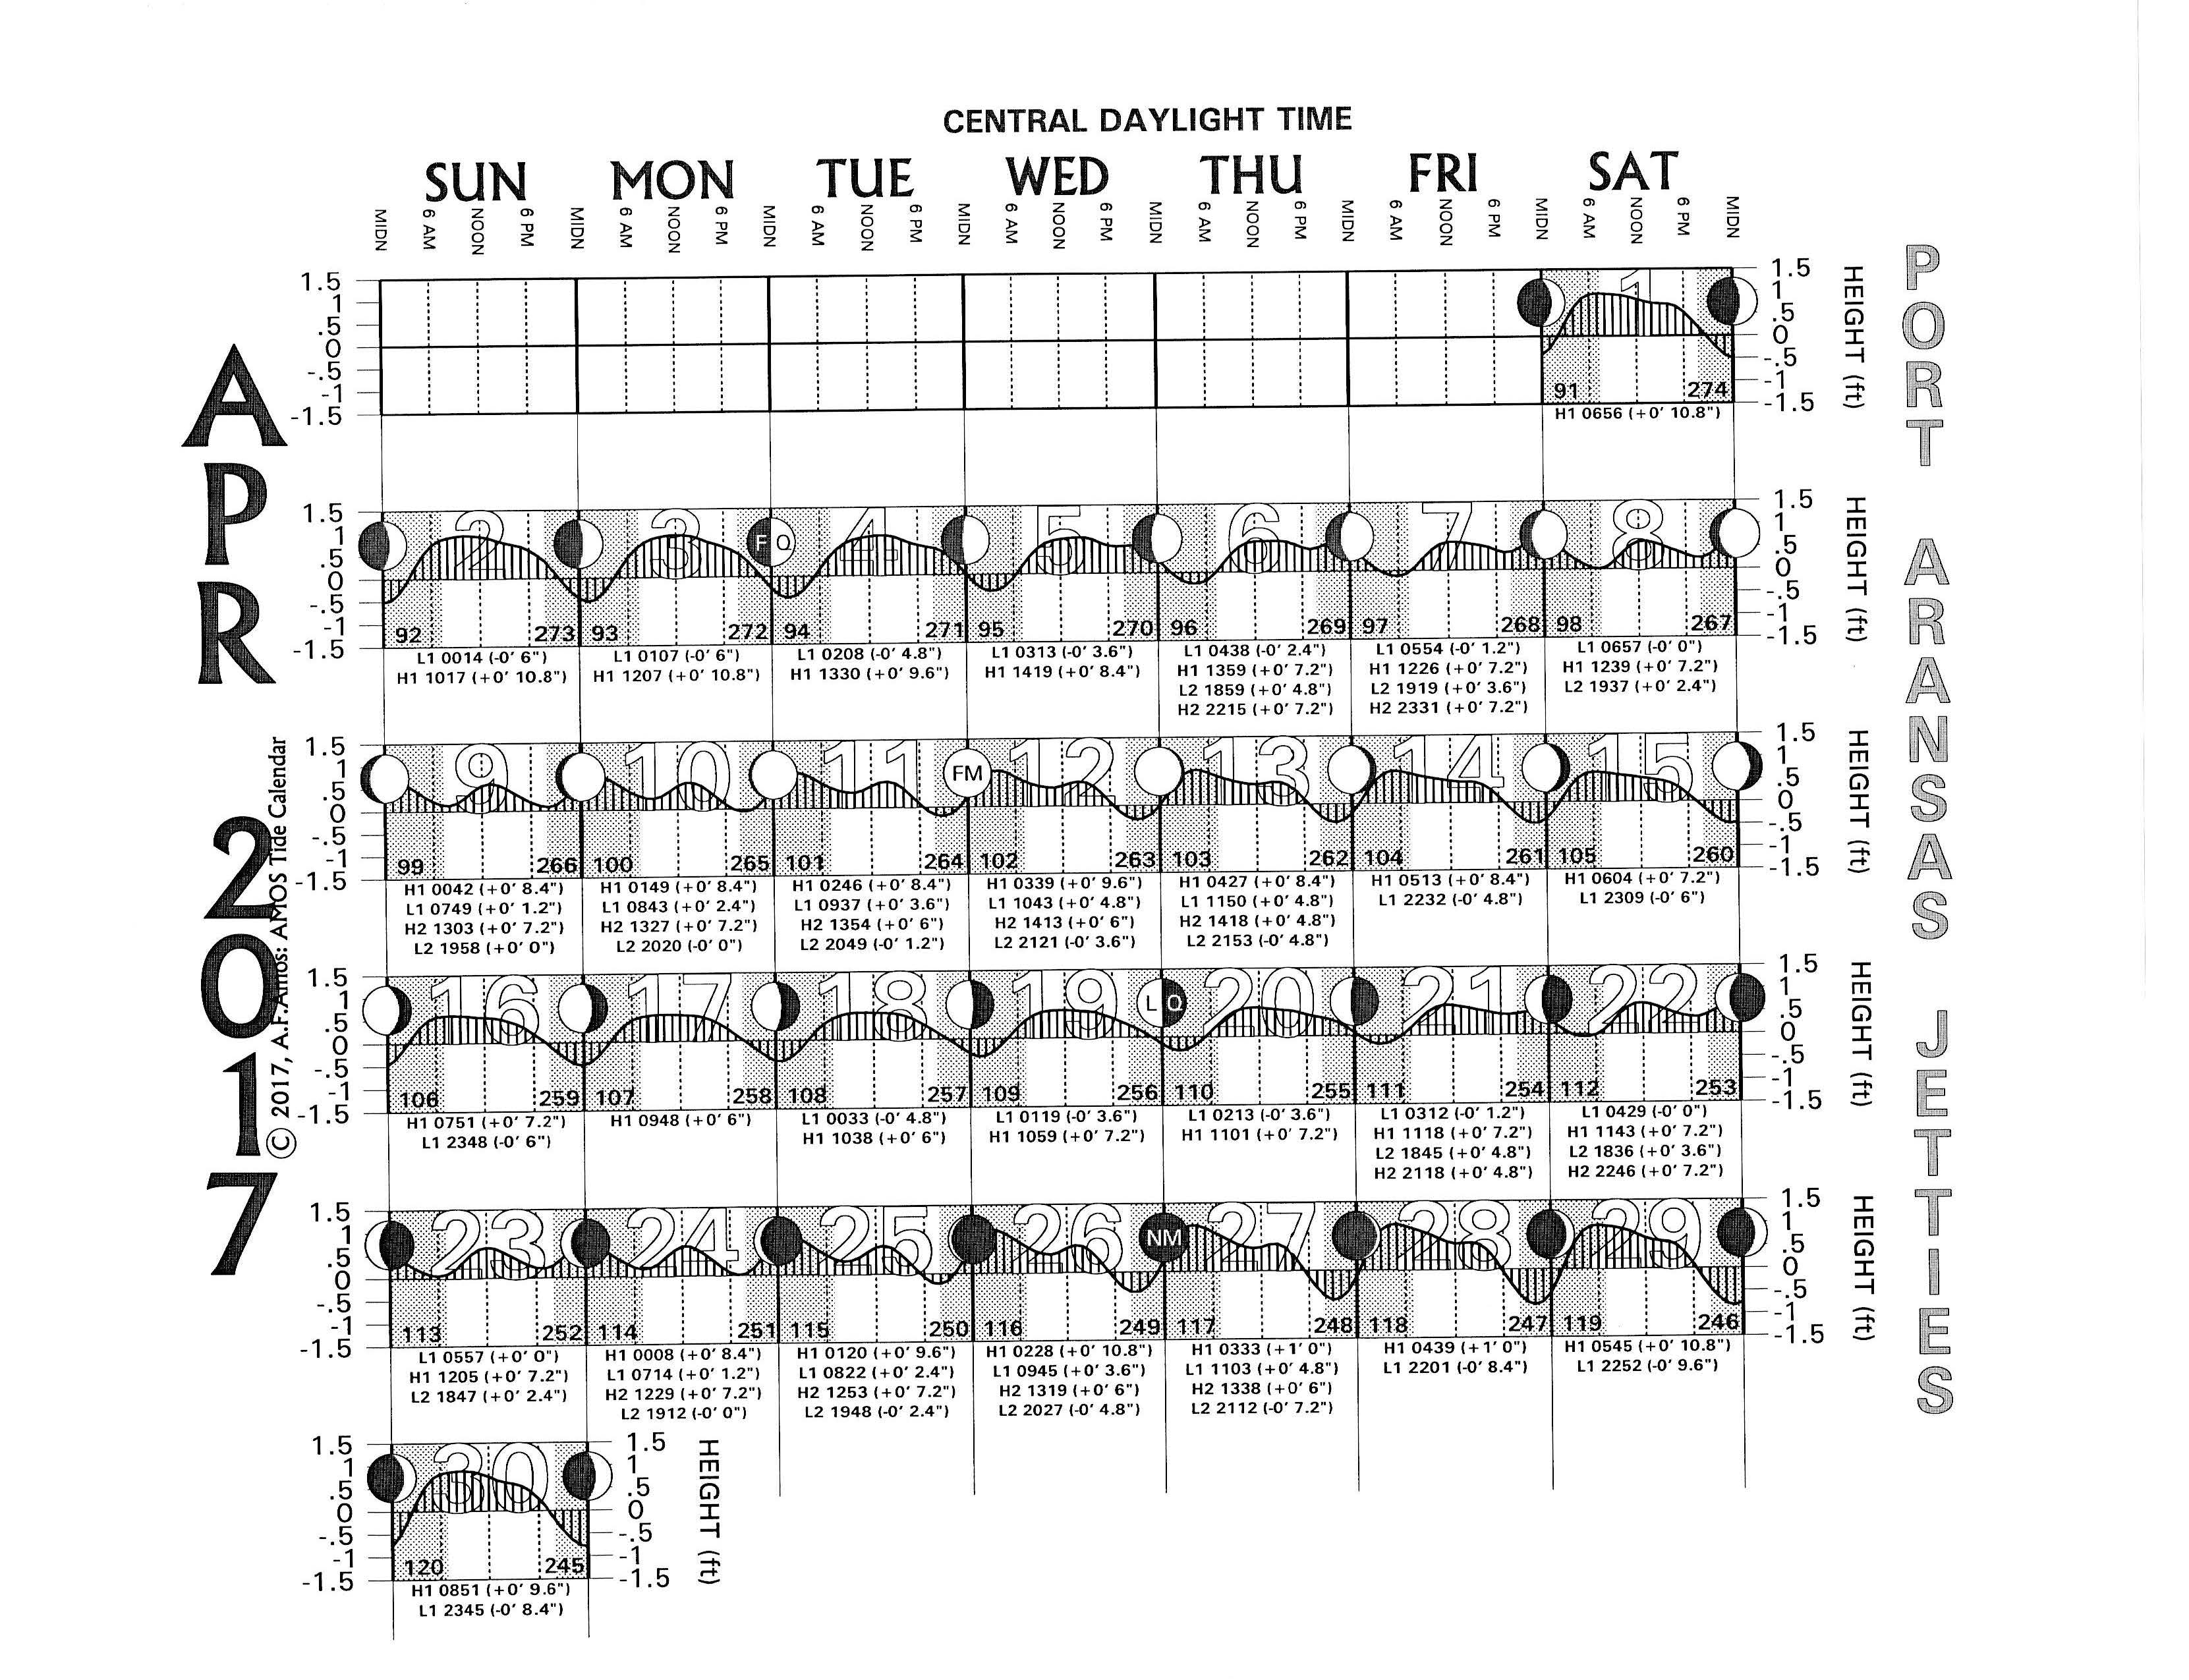
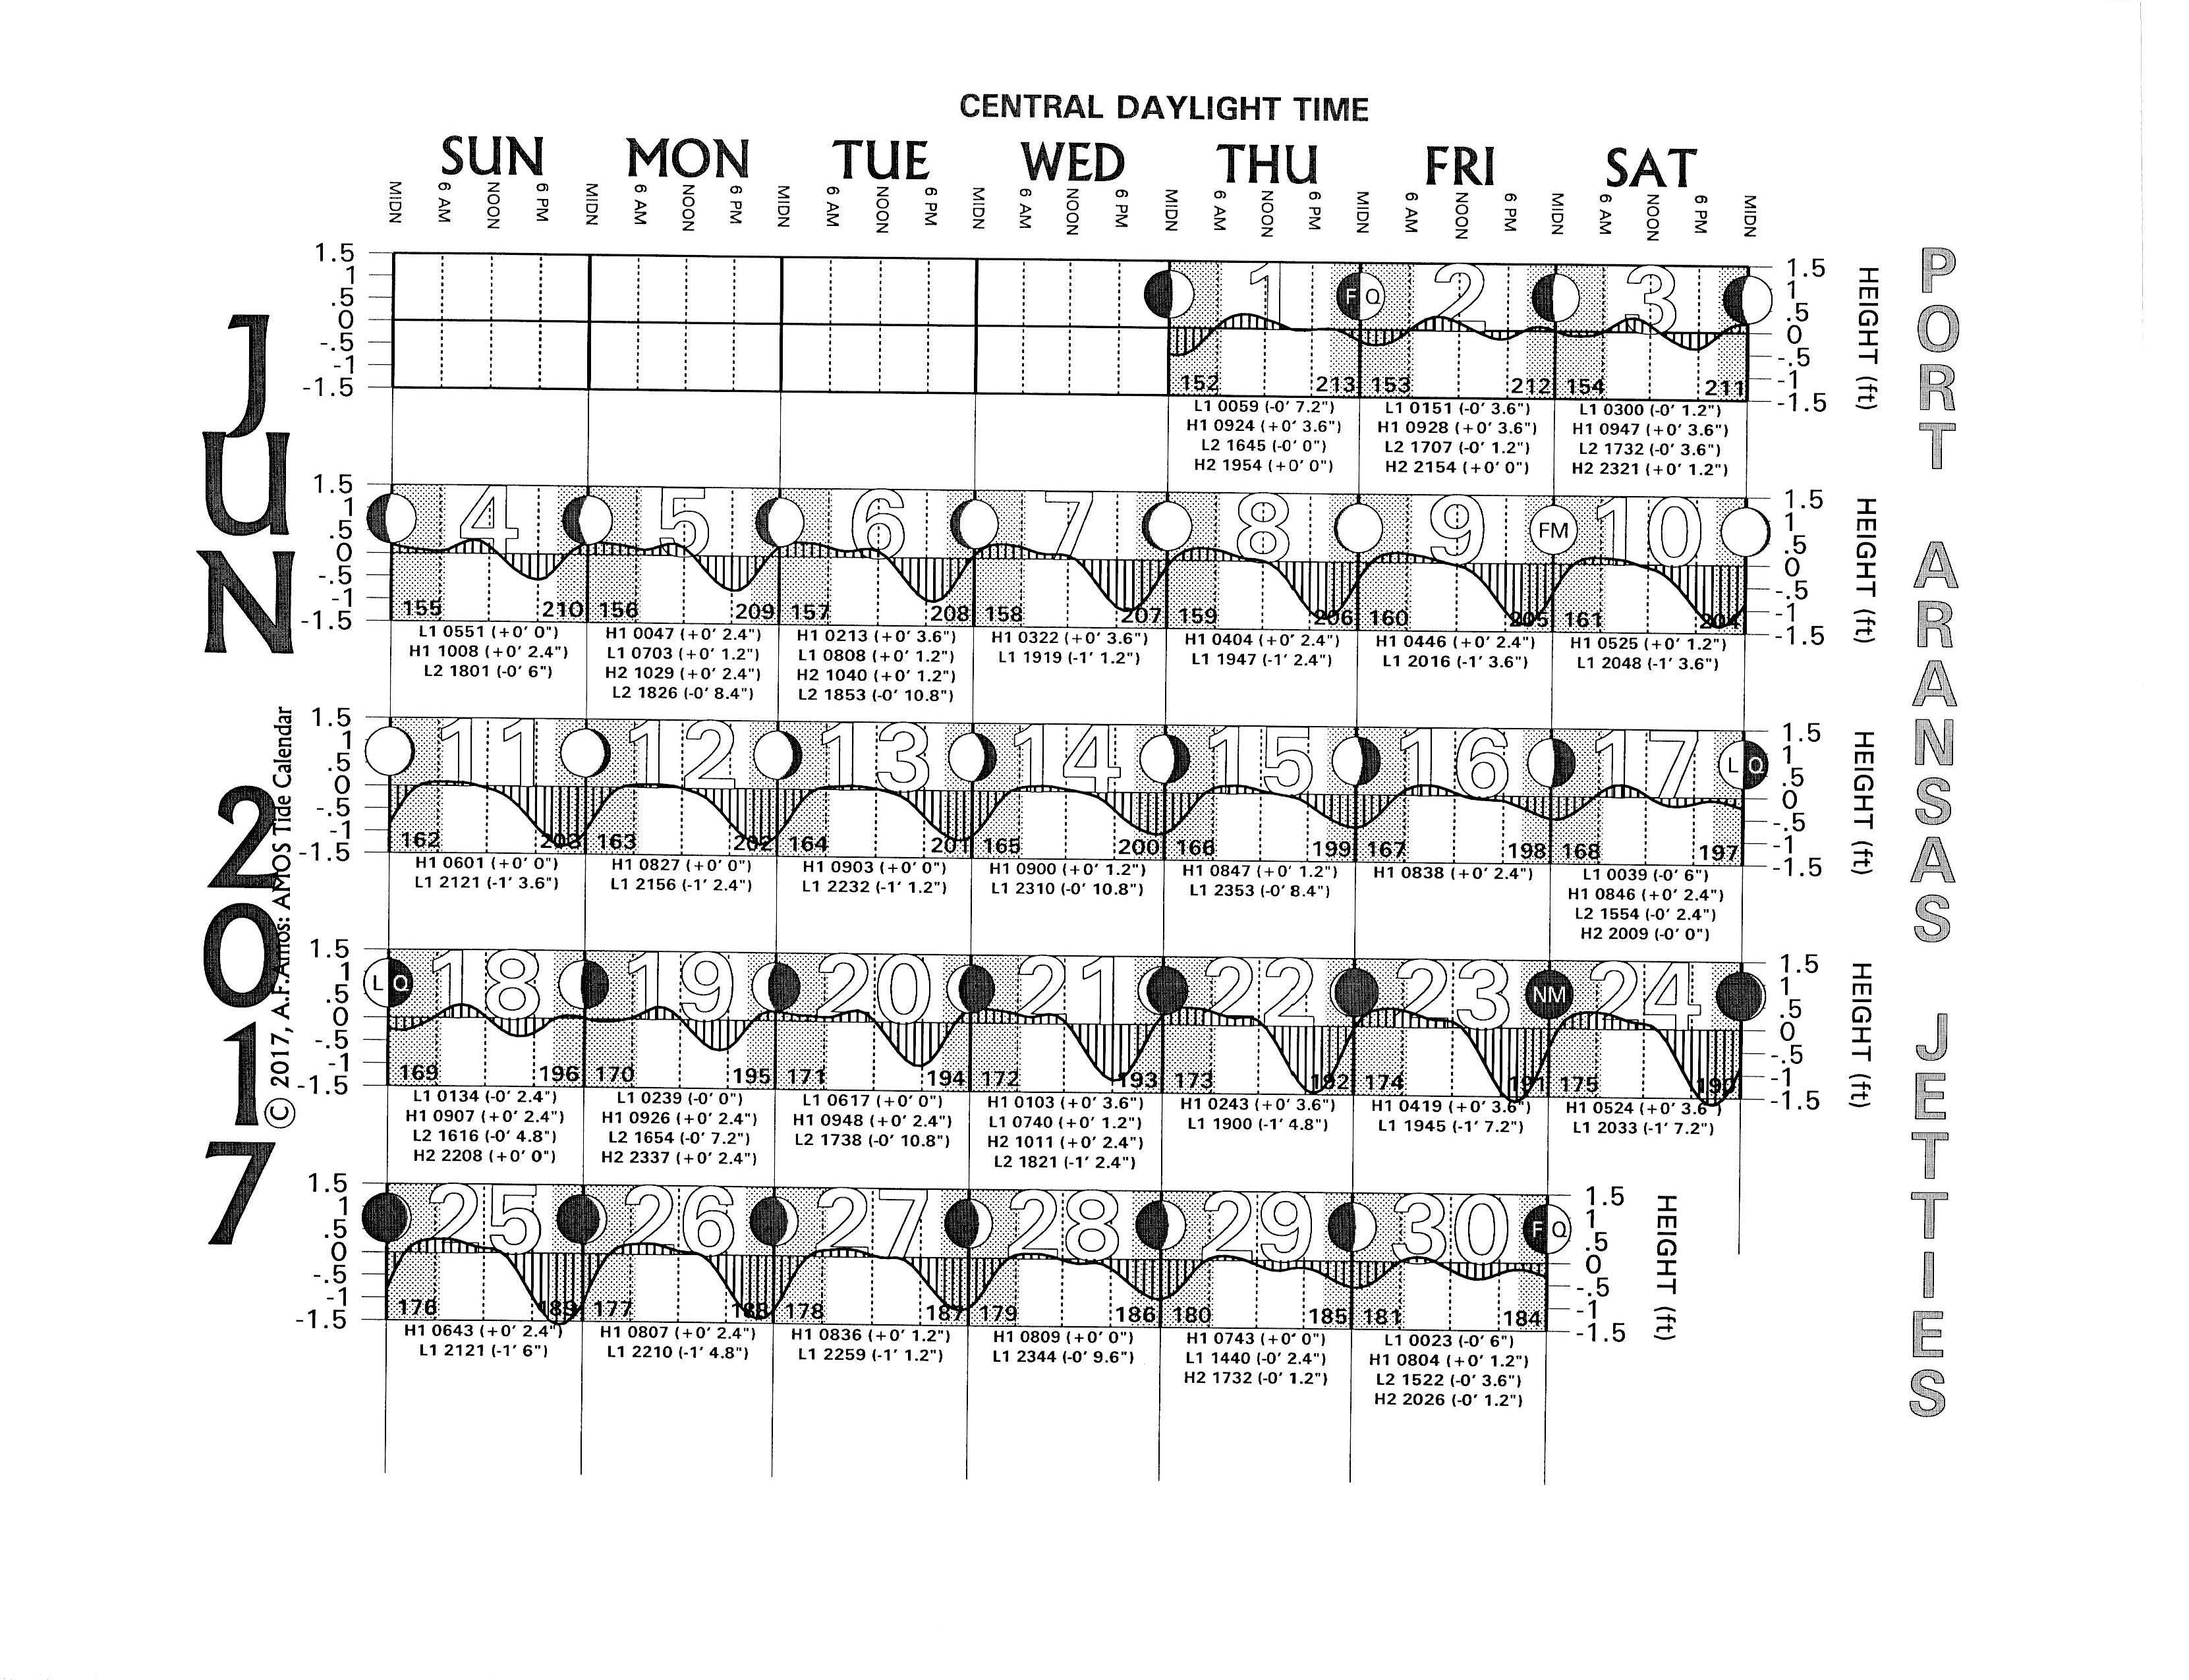
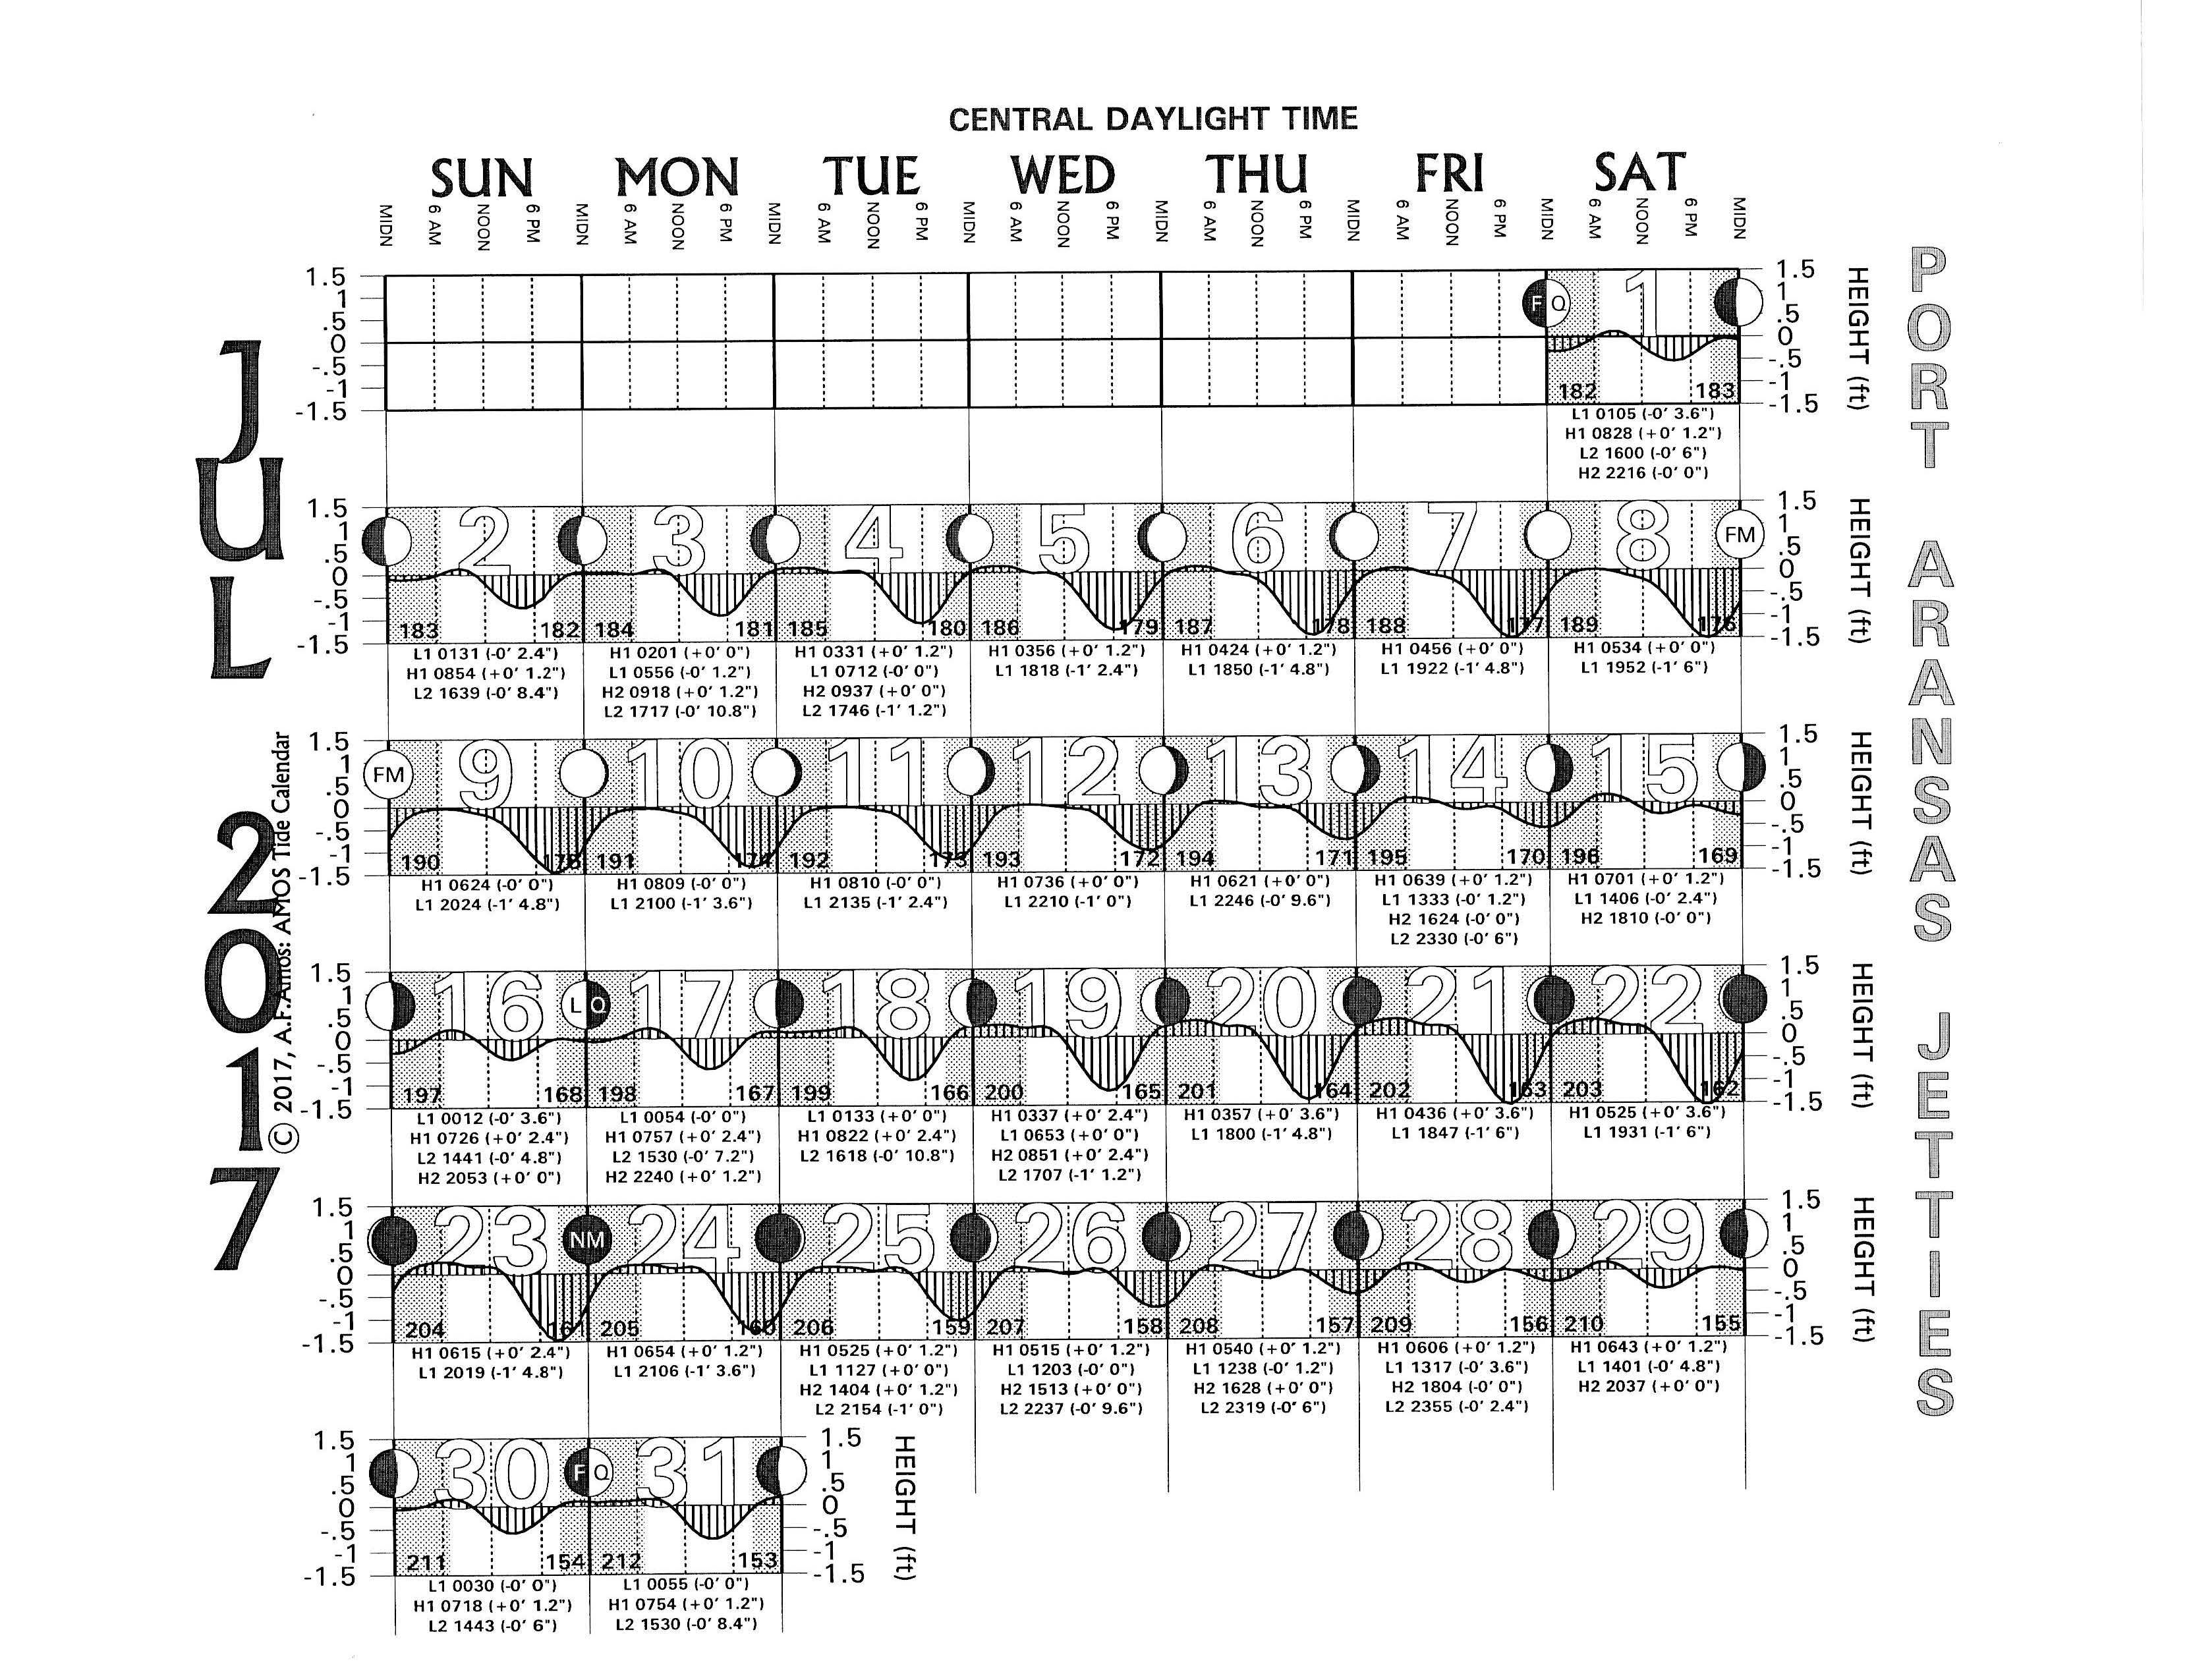
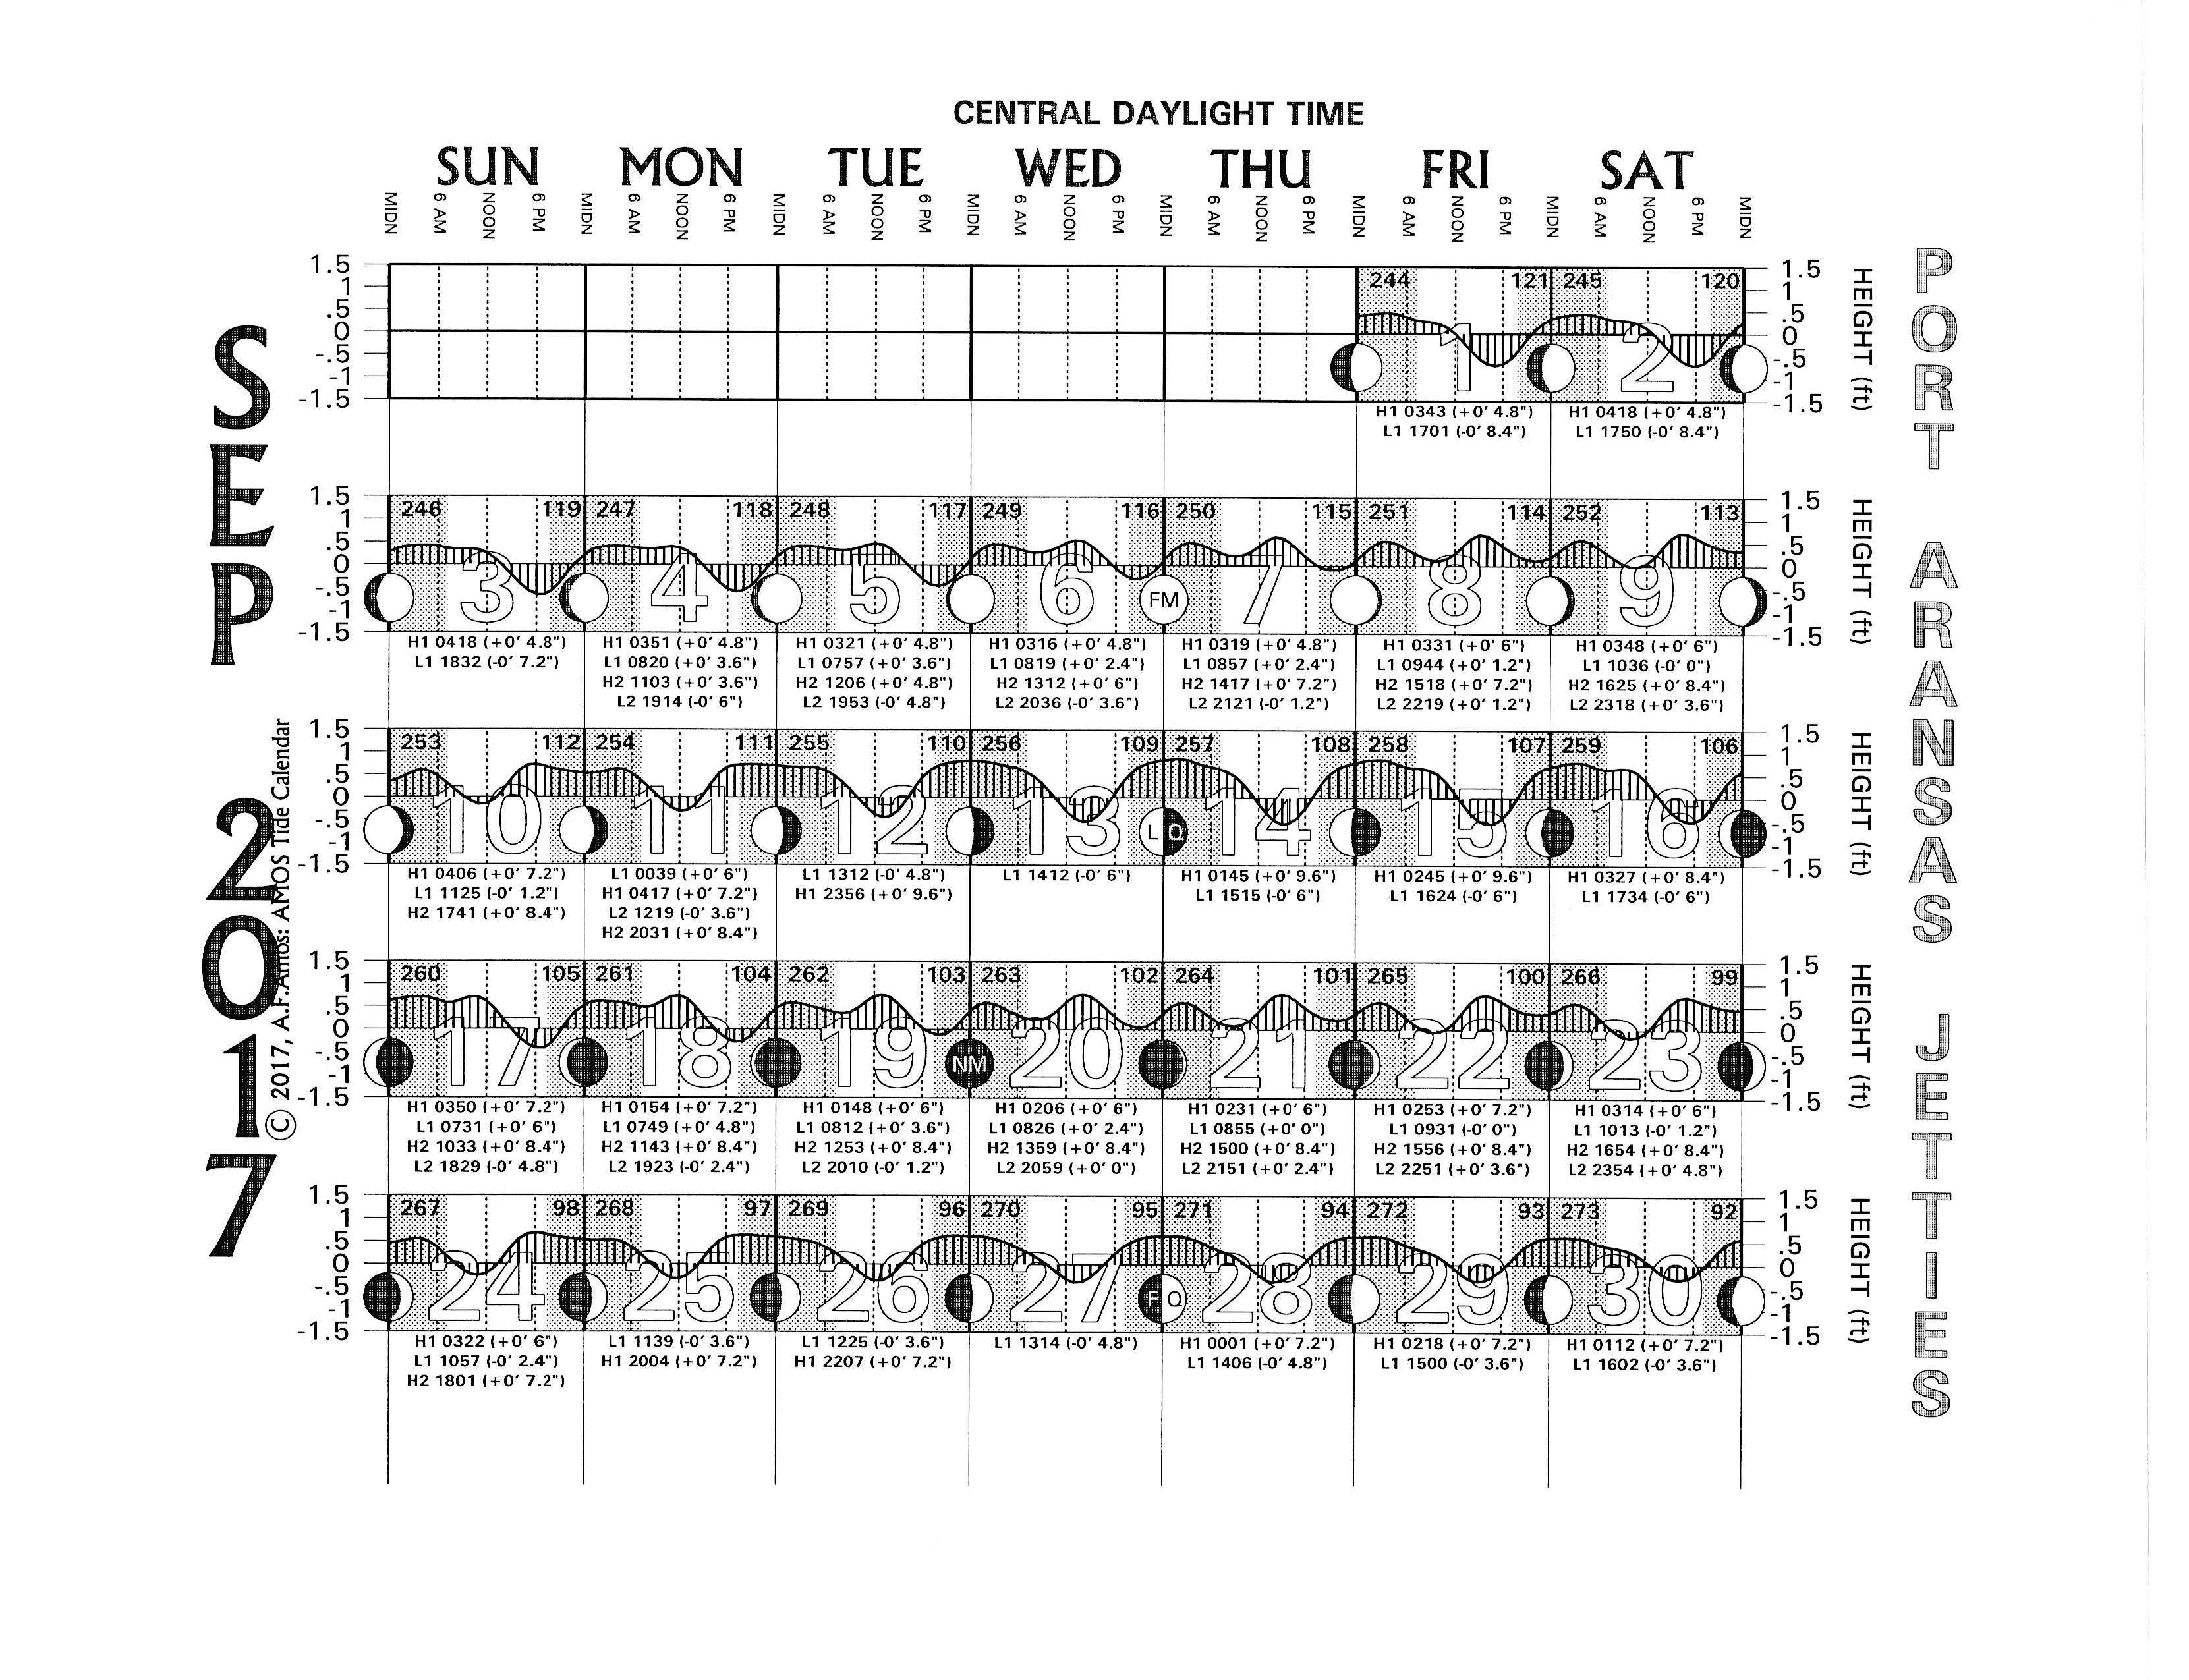
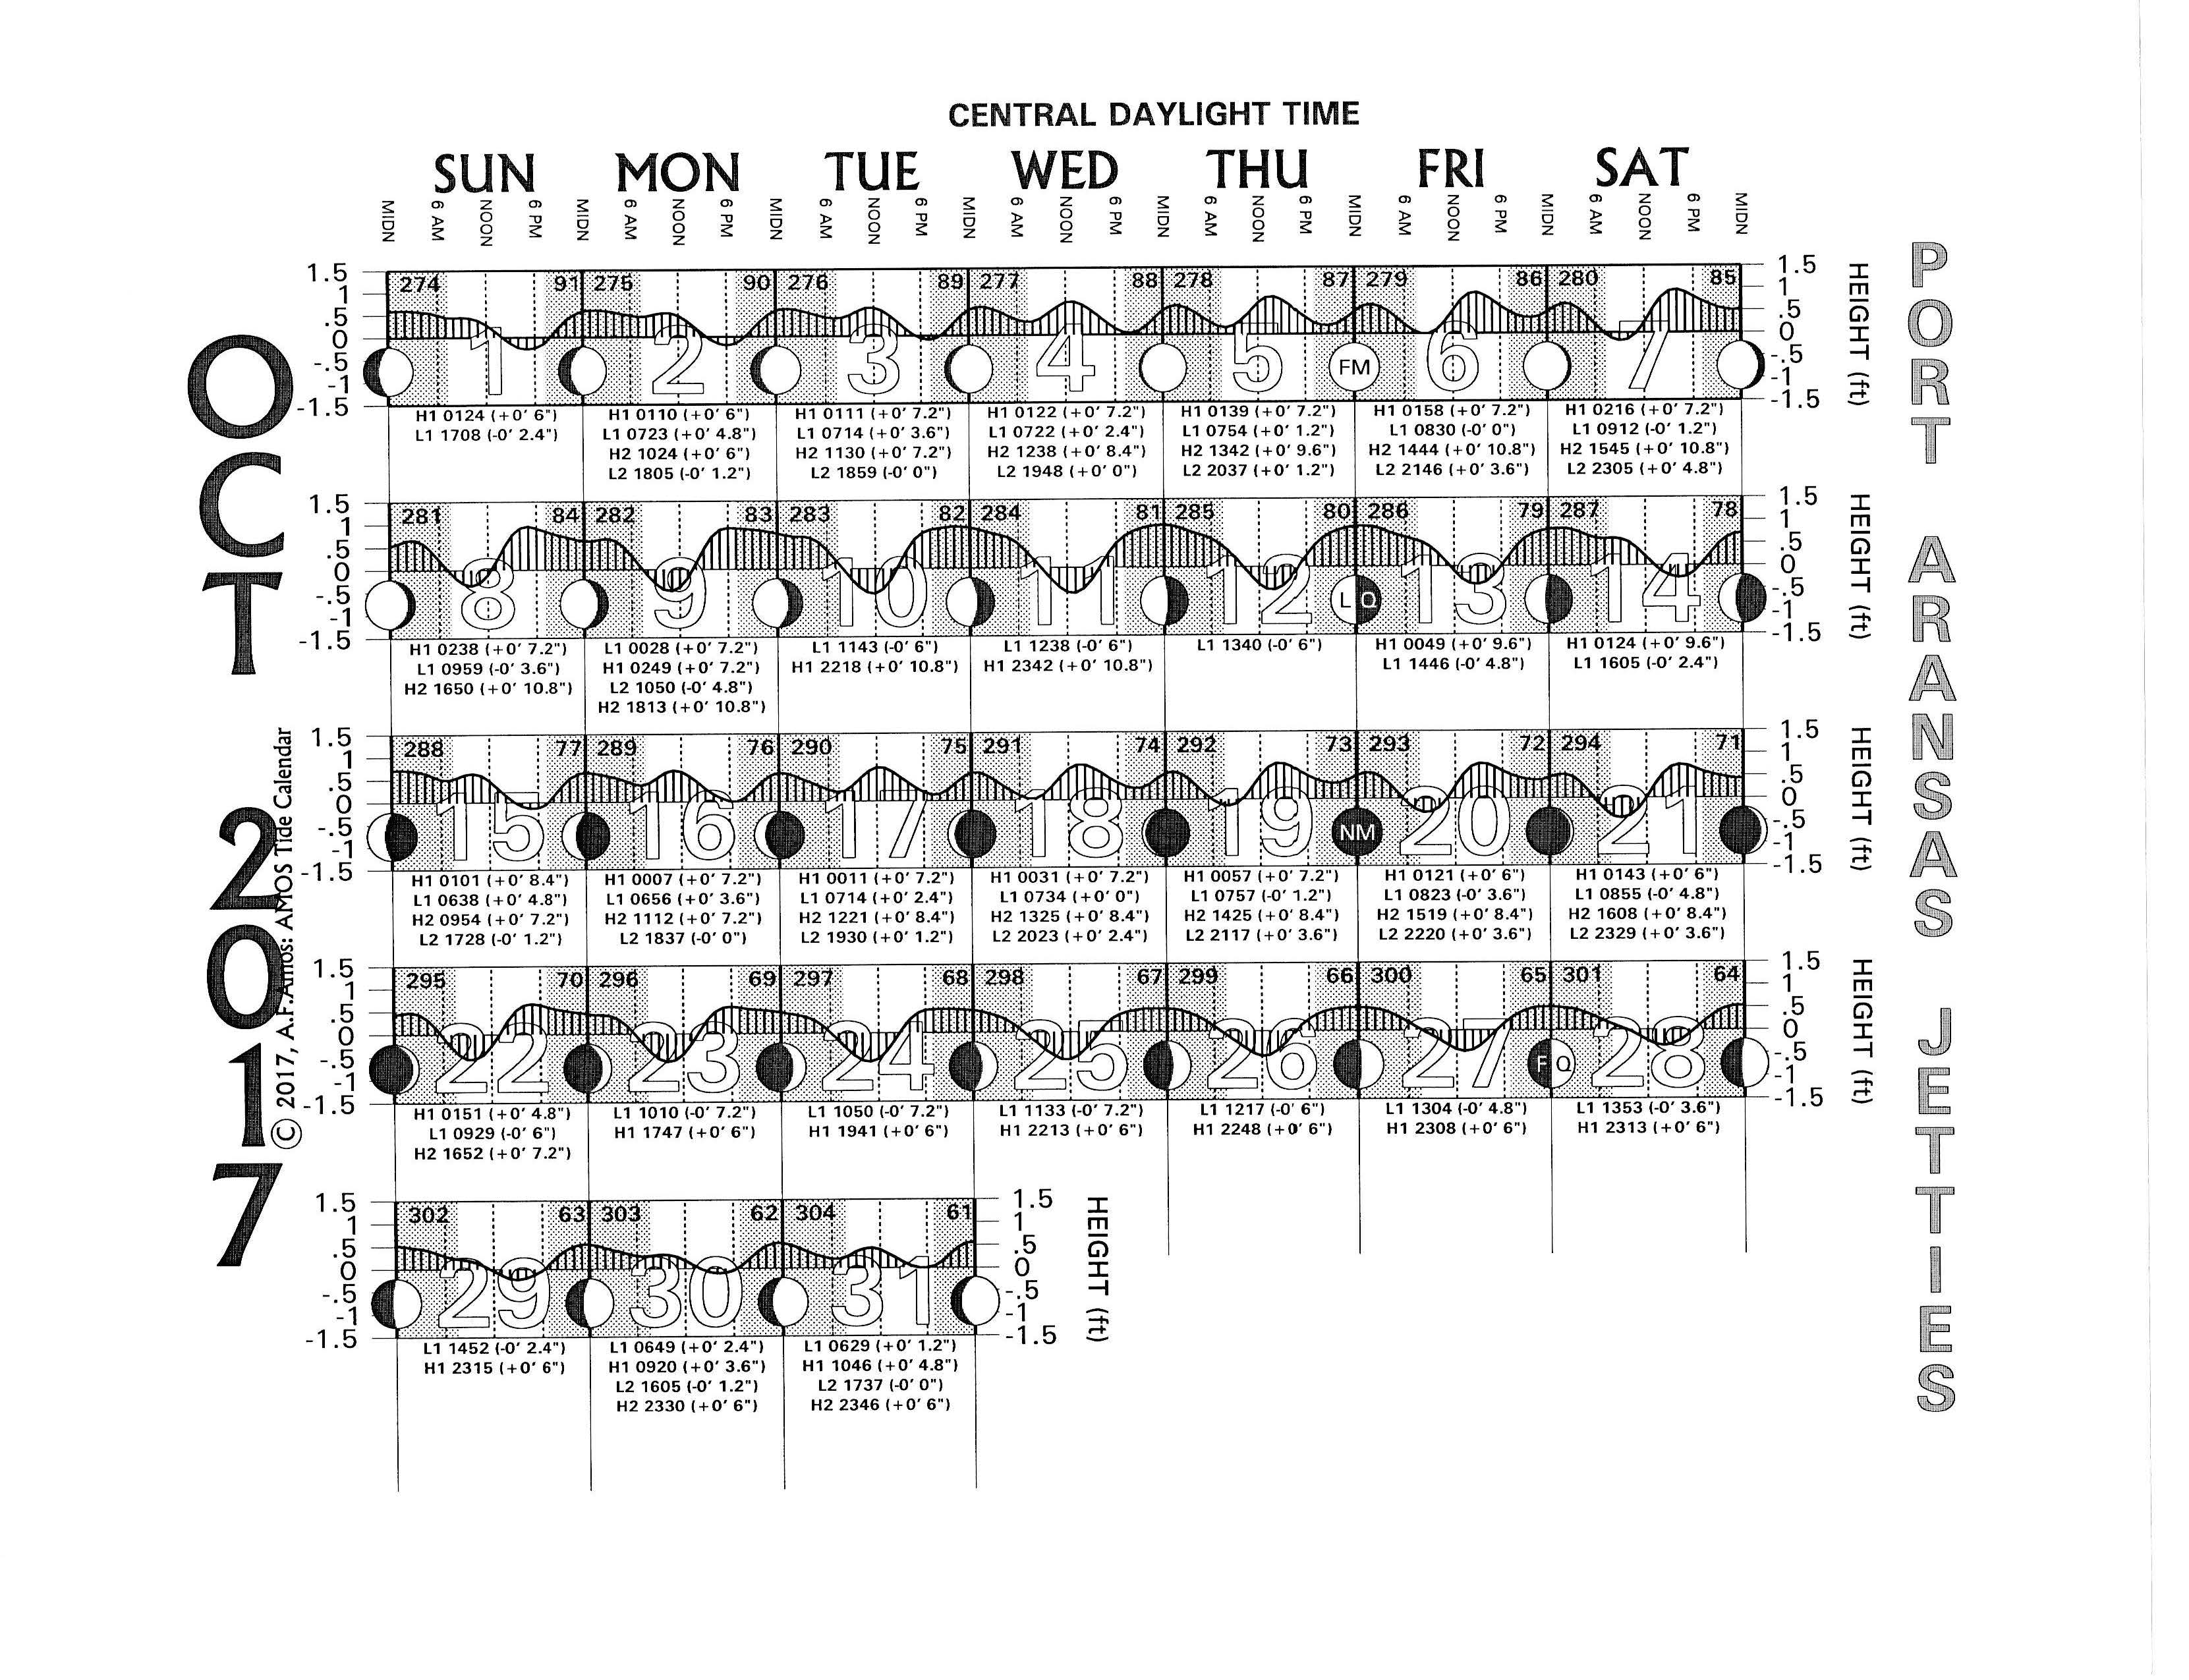
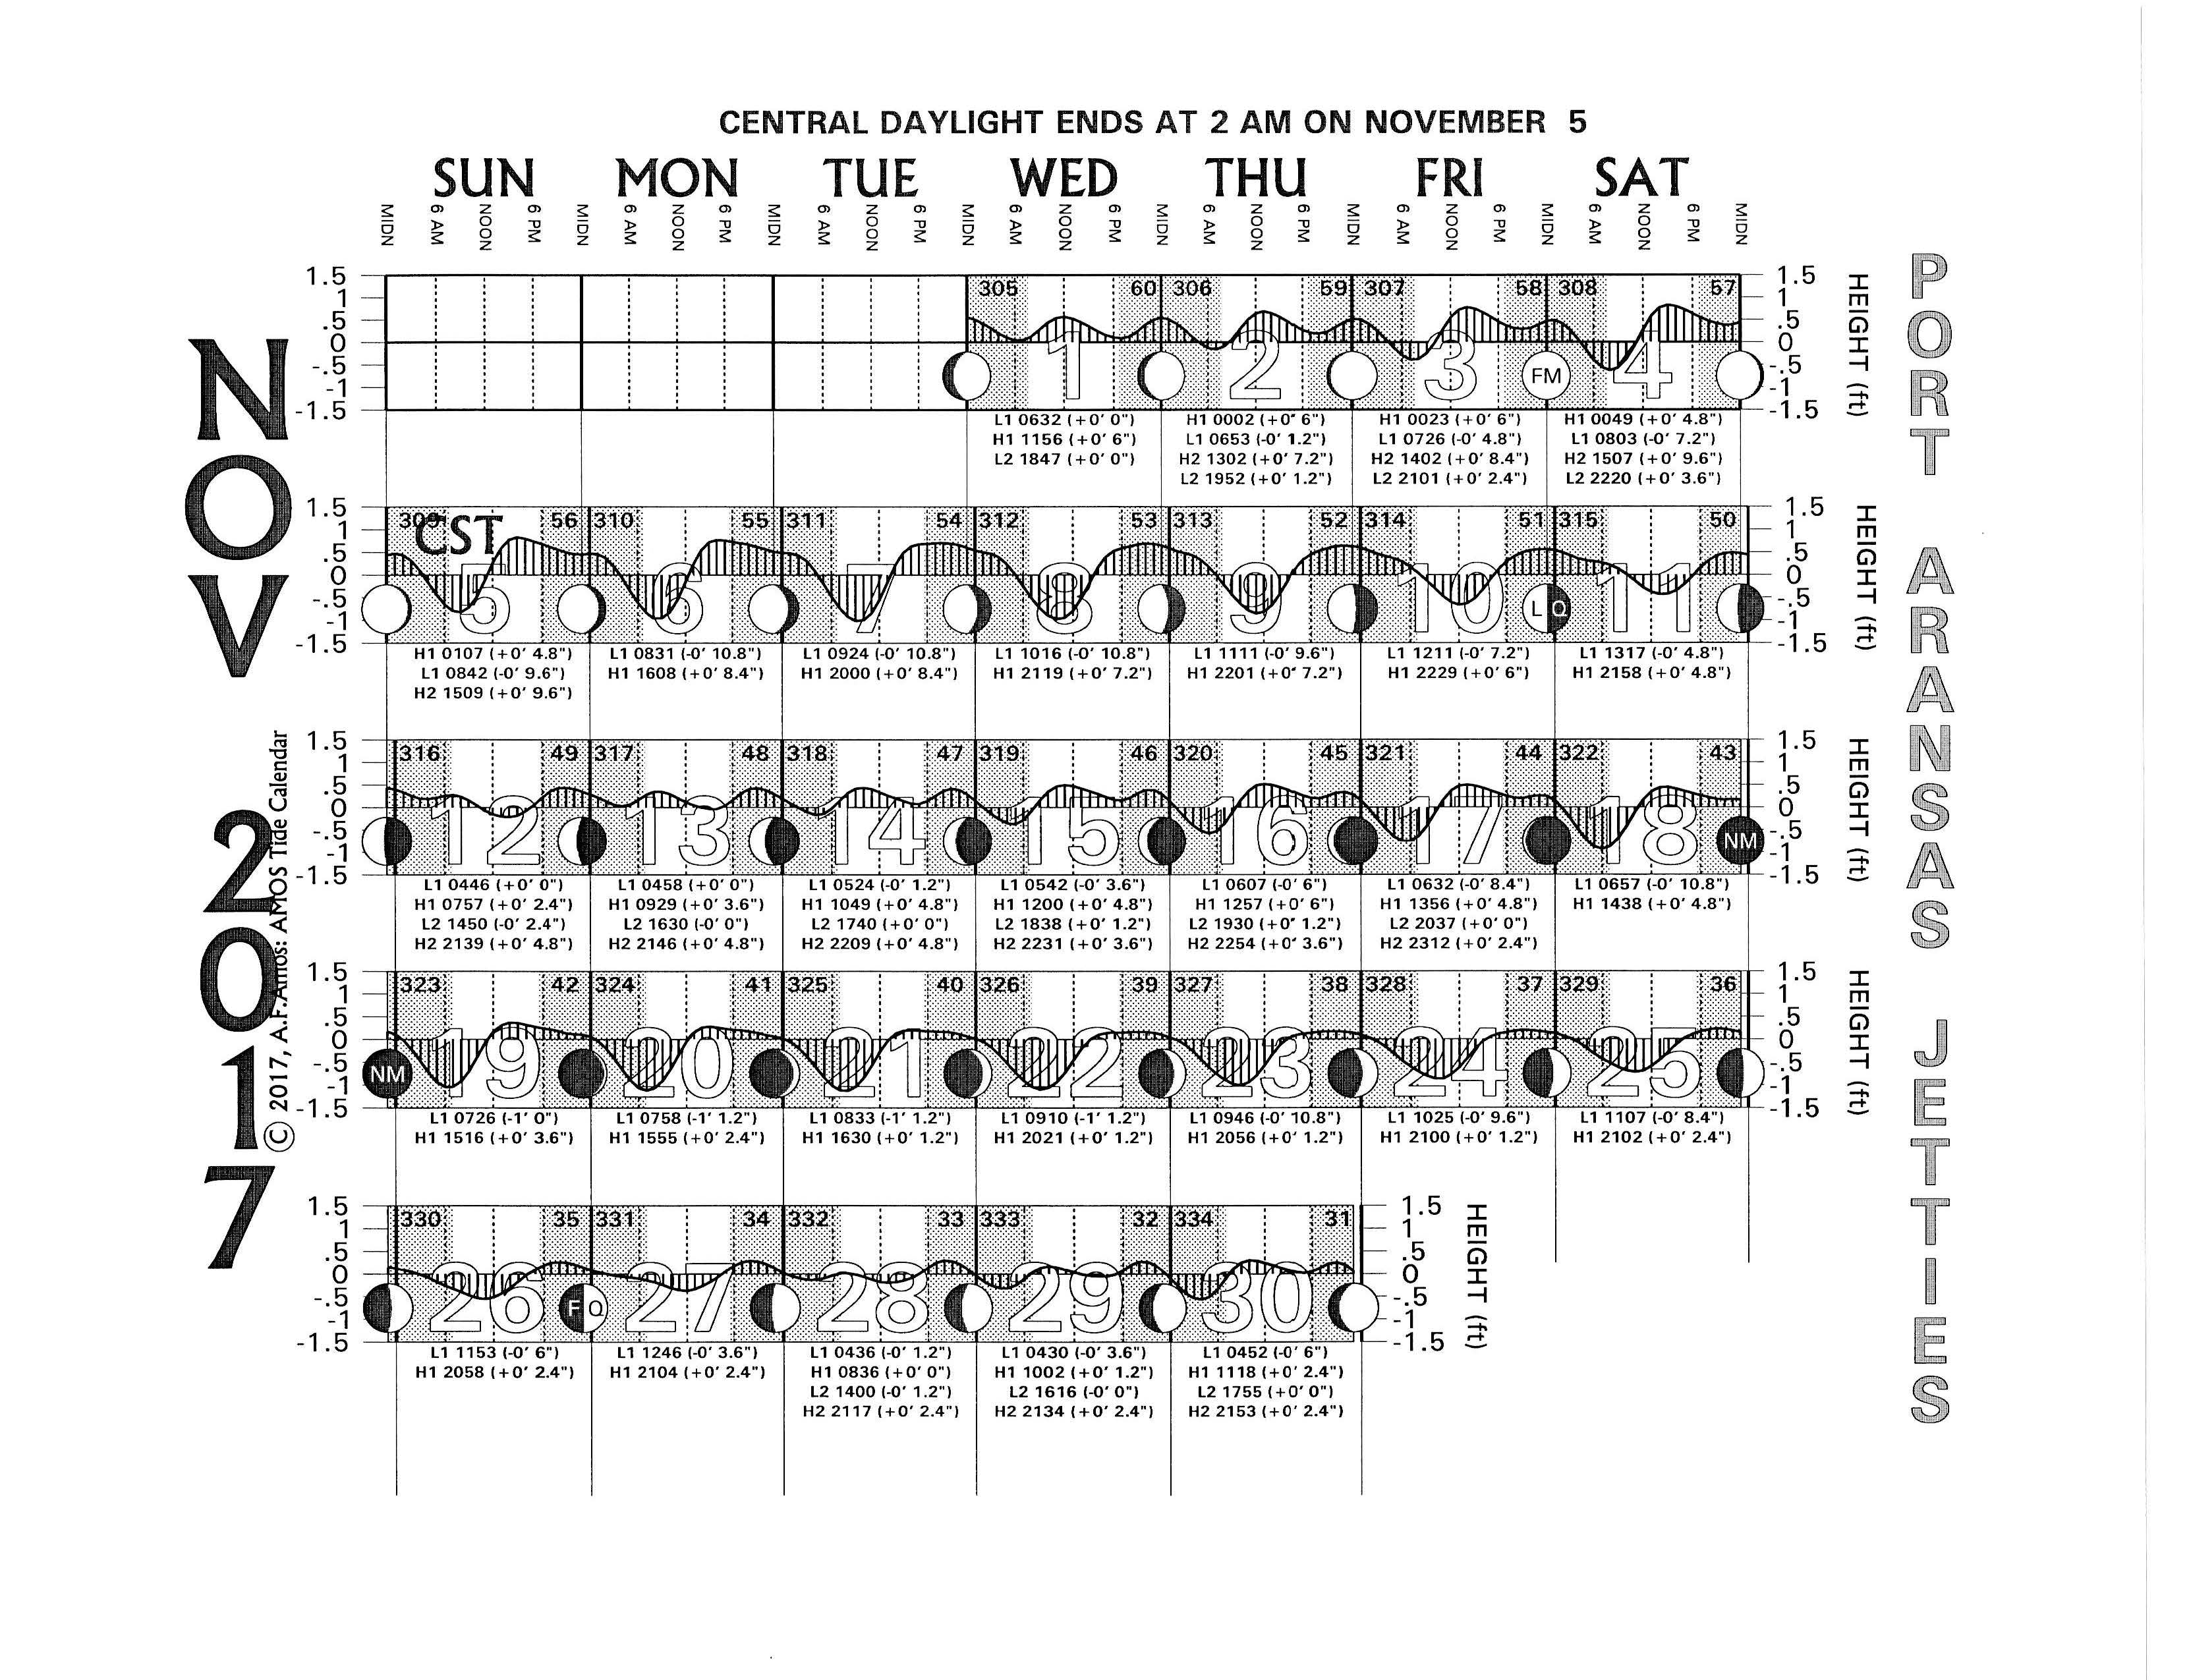
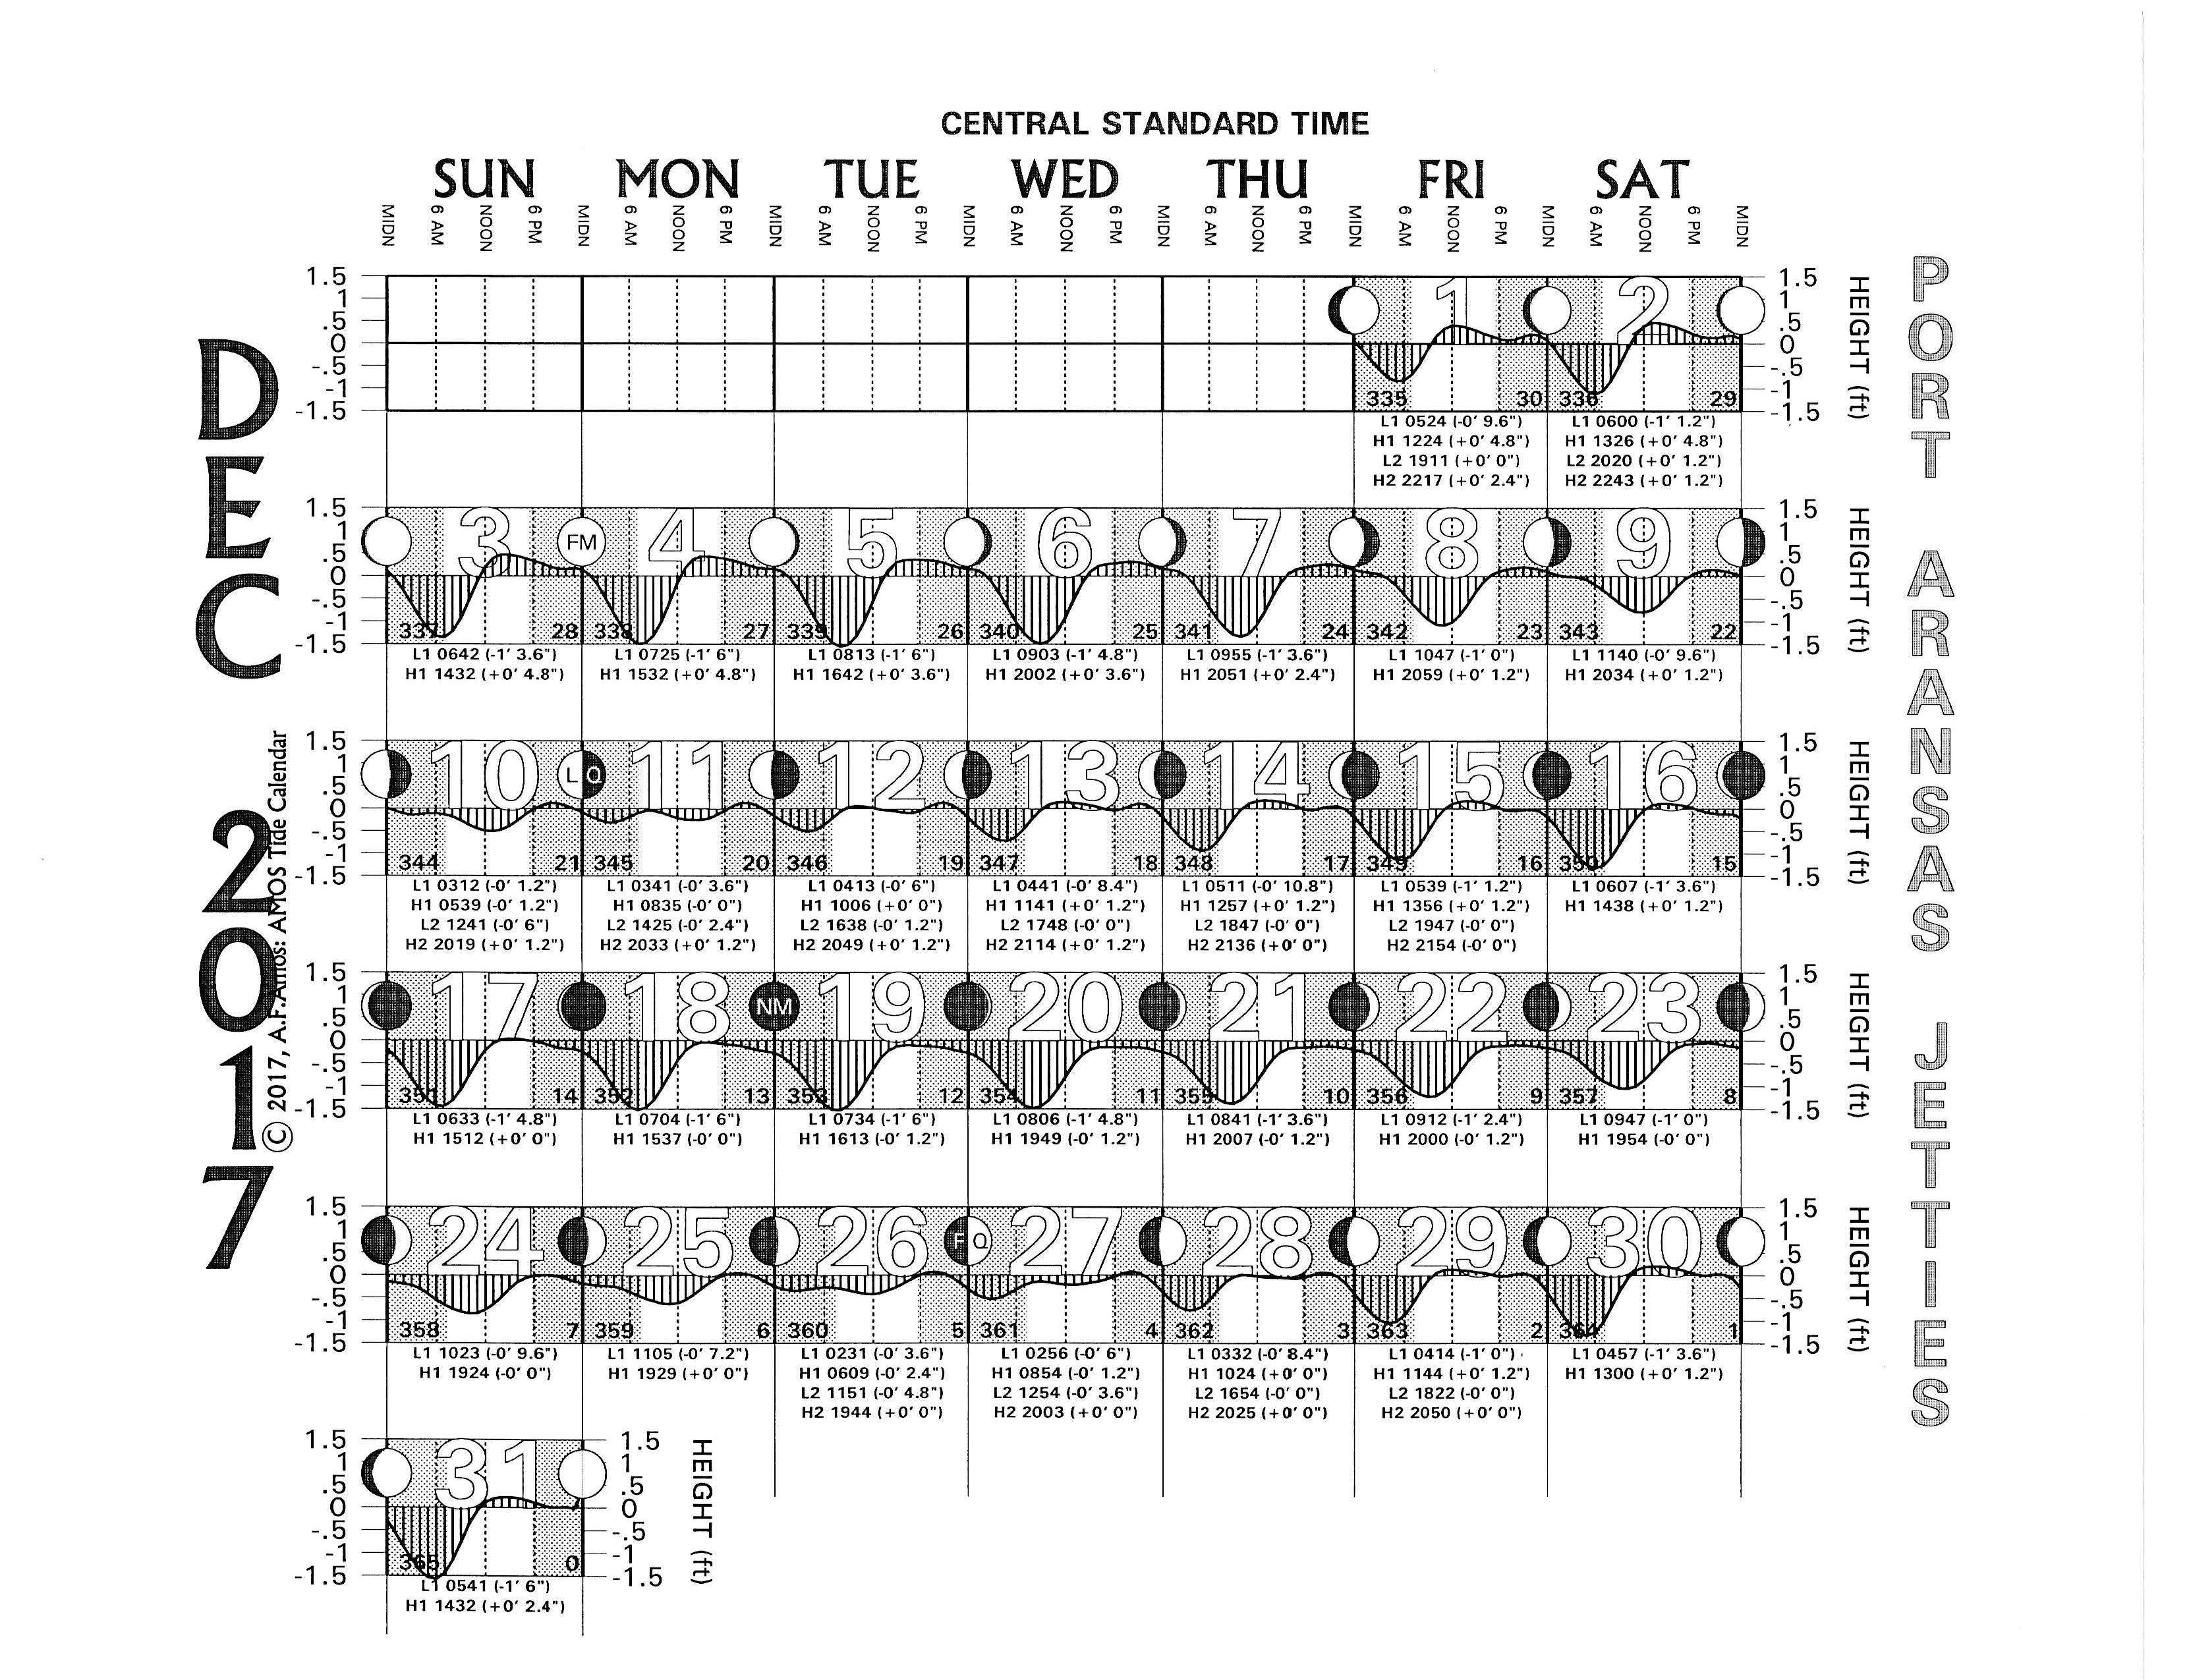
2017 Tide Charts - Texas Tides: Port Aransas Jetties
2016 Tide Charts - Texas Tides: Port Aransas Jetties
2015 Tide Charts - Texas Tides: Port Aransas Jetties
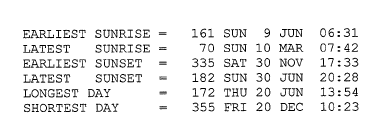
27 Year Weather Summary: 1986-2012
| Temperature (F) |
||||||||||||||||||
| Mean High |
Mean Low |
Median |
Highest High |
Date |
Year |
Lowest High |
Date |
Year |
Highest Low |
Date |
Year |
Lowest Low |
Date |
Year |
||||
| 77.7 |
66.9 |
72.3 |
101.4 |
09/05 |
2000 |
27.5 |
12/23 |
1989 |
84.7 |
07/07 |
1994 |
12.2 |
12/23 |
1989 |
||||
| Rainfall (inches) |
|||||
| Mean |
Mean Rain Days |
Record High |
Year |
Record Low |
Year |
| 34.79 |
75 |
55.56 |
2004 |
12.8 |
2011 |
Data courtesy of: This email address is being protected from spambots. You need JavaScript enabled to view it., The University of Texas at Austin, Marine Science Institute, 750 Channelview Drive, Port Aransas, Texas 78373-5015.
Data collected at: NOAA/National Weather Service Cooperative Weather Observer Station #1071, Port Aransas
Modified: Thursday December 29 16:30 (Central Standard Time) 2011


